Code The City is a civic hacking initiative focused on using tech and (open) data for civic good. We use hack weekends, open data, workshops, and idea generation tools. We run Data Meetups, the Aberdeen Python User Group and the annual Scottish Open Data Unconference
At Code the City we believe that the right people, with the right skills and tools, can do great things. We believe that we can use technology and data to solve many civic challenges. Those beliefs are as applicable now as was when we started seven years ago. And our volunteers who come to our events time and again agree. They know that sharing their skills and knowledge with others in small teams, over a weekend, working on a focussed and achievable project, is a satisfying experience which leaves them with a sense of achievement. It also introduces them to working in teams and in an agile way: short sprints of work and pauses for review.
“The power of one, if fearless and focussed, is formidable, but the power of many working together is better” –
Gloria Macapagal Arroyo
In the last seven years we’ve tackled many topics – and worked with multiple partner organisations in the public and private sector to solve their challenges – and to identify opportunities to use data and technology to improve how they deliver their services.
Throughout that period we’ve had some central principles that we’ve adopted which still hold true:
Data, where appropriate, should be open and licensed for reuse
Software should be developed as open source – where the code can be inspected, and improved on by anyone, and reusable openly by others
Information, images and other content should be as openly licensed as possible to encourage re-use and creativity
Where appropriate stable platforms exist (such as WIkidata, Open Streetmap, Github,or Wiki Commons) we should use those
People working in small teams and in short sprints of activity can achieve an enormous amount over a weekend
Last week at Open UK’s COP26 event “Open Technology for Sustainability”, which our co-founder and trustee Ian Watt attended, those same principles that inspired our creation, and inform our continuing work, were echoed time and again by speakers. And at the evening awards dinner we were runners-up to the the wonderful Open Knowledge Foundation, in the Data category. This further validates our belief in our approach.
CTC’s Runner-up trophy for data in Open UK’s 2021 awards
More recently we’ve been concentrating even harder on improving open data in Scotland and the UK – but not to the exclusion of other projects. In addition to several history and heritage projects which have seen large amounts of open data created and published, we’ve had projects such as Open Wastemap which was built almost entirely over two CTC weekend and uses community-sourced data in Wikidata and OpenStreetmap to power this really useful tool to find local recycling facilities.
Our next event CTC24 – Open In Practice is taking place in just over a week. It is the perfect introduction to what we do and to becoming involved. We already have a list of potential projects that attendees, new and experienced, can get involved in. Some of these are local in scale and some national. All need a blend of skills from attendees. You don’t need to be either a coder or data expert to participate. You can sign up directly here or from the event link above.
No excuses: be part of the group that does the good things – or stand by and watch while we do!
One of the biggest strengths of the events we run at CTC is the wide variety of projects we undertake, with each one being engaging in a completely different way. In our last blog post we looked at the ‘History + Data = Innovation’ and ‘History and Culture’ events which highlighted interesting records from the 19th and 20th century and which generate new open data from historic sources. The Event we’re looking at today however, ‘Archeology Meets Data Science’ uncovers an even older part of Aberdeen’s History.
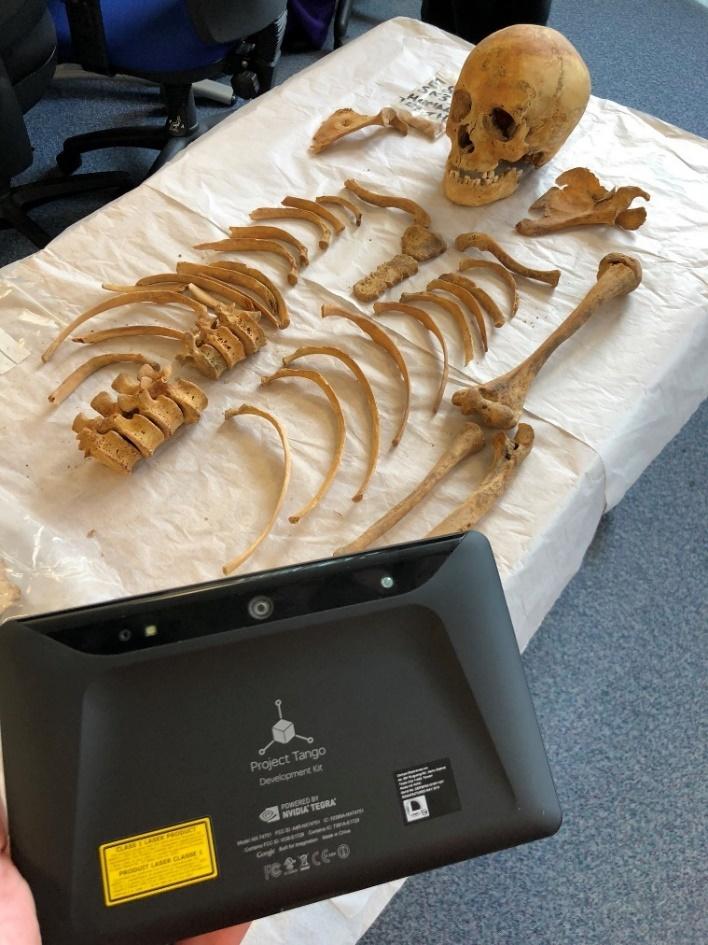
To give some context, an excavation of St Nicholas Kirk from 2006-2007 uncovered more than a thousand human remains and artefacts, as well as parts of the building dated at over a thousand years old. In 2018 we were granted the opportunity to work with data taken from the excavation as well as work with some of the human remains themselves – certainly not the usual kind of work you’d expect to carry out at a hack event! Six teams were formed to work on various aspects of the project such as working through the original data and compiling supplementary info in an extensive Q&A document.
The team which mostly worked with the Skeletons used a technique called Photogrammetry – this involves taking photos from many angles which with the right software, can be used to create a 3d model.
While some experts were involved with the project many of the team had never done something like this, so there was a lot of trial and error with finding the right software. Eventually their perseverance paid off however, and the result is a great looking archive of the scanned remains freely available online.
As well as this we also had a team of 3d modellers use Unity to recreate the burial site as well as where the skeletons were located. There’s even Virtual Reality support if you own an Oculus Go, and the burial can be accessed here.
Ali Cameron was one of the experts involved in the project, having been involved in the field for more than 40 years, and was impressed with the work we carried out. We asked about her thoughts regarding the project, she had the following to say:
Some of the quieter students really came out of their shells, we all got a chance to meet the coders and I have kept up with a couple of them to discuss other projects. The coders really enjoyed the archaeology side and I chatted with them all about the aspect they were working on which is quite different from a lot of the programming they had done before. The Event was extremely successful and very fascinating.
Overall the project turned out to be quite an unforgettable experience for those involved. It challenged our team and volunteers in an interesting way, and was a unique chance to interact with some of the oldest relics in Aberdeen’s history. It also highlights our goal of making data accessible very well, as we took a fascinating discovery and allowed its contents to be made freely available online thanks to our 3d modelling endeavors.We have a more in-depth post regarding the project for those wanting to find out more.
If the work we carry out interests you then our next event, ‘CTC24 – Open in Practice’, is only a few weeks away, with more information and booking links here.
CTC23 – the future of the City. A new theme to explore. After introductions, initial ideas were sought for the Miro board – to ease us along Bruce put on some Jazz music. This was to inspire Dimi to put forward an idea on how sounds in a City could be. This post-its gathered interest and the Social Sounds project and team was formed.
Dimi shared his vision and existing knowledge on sound projects, namely, Luckas Martinelli project This would become the algorithmic starting point visualising sound data on a map. The first goal was to using this model and apply it and visualise a sound map of Aberdeen. This was achieved over the weekend but was only half of the visualisation goals. The other half was to look build a set of tools that would allow communities to envision and demonstrate noise pollution reductions through interventions, green walls, trees plantings or even popup band stands. An early proof of concept toolkit was produced. The social in social sounds references to community, connecting all those connected by sound and place. The product concluded by show how this social graph could be export to a decision making platform e.g.loomio.org
What is next? The algorithmic model needs to be ground with real world sound sensor data. Air quality devices in Aberdeen can be upgraded with a microphone. Also, noise itself needs to be included in the map experience, this can be achieved through a sound plug in of existing recordings. The toolkit needs much more work, it needs to give members of the community the ability to add their own intervention ideas and for those ideas to be visualised on the map, highlight the noise reduction potential or enhancement, permanent or temporary. Much achieved, much to do.
Open data has the power to bring about economic, social, environmental, and other benefits for everyone. It should be the fuel of innovation and entrepreneurship, and provide trust and transparency in government.
But there are barriers to delivering those benefits. These include:
Knowing who publishes data, and where,
Knowing what data is being published – and when that happens, and
Knowing under what licence (how) the data is made available, so that you can use it, or join it together with other agencies’ data.
In a perfect world we’d have local and national portals publishing or sign-posting data that we all could use. These portals would be easy to use, rich with metadata and would use open standards at their core. And they would be federated so that data and metadata added at any level could be found further up the tree. They’d use common data schemas with a fixed vocabulary which would be used as a standard across the public sector. There would be unique identifiers for all identifiable things, and these would be used without exception.
You could start at your child’s school’s open data presence and get an open data timetable of events, or its own-published data on air quality in the vicinity of the school (and the computing science teacher would be using that data in classes). You could move up to a web presence at the city or shire level and find the same school data alongside other schools’ data; and an aggregation or comparison of each of their data. That council would publish the budget that they spend on each school in the area, and how it is spent. It would provide all of the local authority’s schools’ catchment areas or other LA-level education-specific data sets. And if you went up to a national level you’d see all of that data gathered upwards: and see all Scottish Schools and also see the national data such as SQA results, school inspection reports – all as open data.
But this is Scotland and it’s only six years since the Scottish Government published a national Open Data Strategy; one which committed data publication would be open by default.
Looking at the lowest units – the 32 local authorities – only 10, or less than a third, even have any open data. Beyond local government, of the fourteen health boards none publishes open data, and we note that of the thirty Health and Social Care Partnerships onlyone has open data. Further, in 2020 it was found that of an assumed 147 business units comprising Scottish Government (just try getting data of what comprises what is in the Scottish Government) – 120 have published no data.
And, of course there are no regional or national open data portals. Why would Scottish Government bother? Apart, that is, from that six year old national strategy and an EU report in 2020 from which it was clear that OD done well would benefit the Scottish economy by around £2.21bn per annum? Both of these are referred to in the Digital Strategy for Scotland 2021.
Why there is no national clamour around this is baffling.
And despite there being a clear remit at Scottish Government for implementing the OD Strategy no-one, we are told, measures or counts the performance nationally. Because if you were doing this poorly, you’d want to hide that too, wouldn’t you?
And, for now, there is no national portal. There isn’t even one for the seven cities, let alone all 32 councils. Which means there is
no facility to aggregate open data on, say, planning, across all 32 councils.
no way to download all of the bits of the national cycle paths from their custodians.
no way to find out how much each spends on taxis etc or the amount per pupil per school meal.
There is, of course, the Spatial Hub for Scotland, the very business model of which is designed (as a perfect example of the law of unintended consequences) to stifle the publication of open data by local government.
So, if we don’t have these things, what do we have?
What might we expect?
What should we expect from our councils – or even our cities?
Remember, back about 2013 , both Aberdeen and Edinburgh councils received funding from Nesta Scotland to be part of Code For Europe where they learned from those cities above. One might have expected that by now they’d have reached the same publication levels as these great European cities by now? We’ll see soon.
But let’s be generous. Assume that each local authority in Scotland could produce somewhere between 100 and 200 open data sets.
Scotland has 32 local authorities
Each should be able to produce 100 – 200 datasets per authority – say 150 average
= 150 x 32 = 4800 data sets.
The status quo
Over the weekend our aim was to look in detail at each of Scotland’s 32 local authorities and see which was publishing their data openly – to conform with the 2015 Open Data Strategy for Scotland. What did we find?
Our approach
As we’ve noted above there is no national portal. And no-one in Scottish Government is counting or publishing this data. So, following the good old adage, “if you want something done, do it yourself”, a few of us set about trying to pull together a list of all the open datasets for Scotland’s 7 cities and the other 25 authorities. For the naive amongst us, it sounded like an easy thing to do. But getting started even became problematic. Why?
Only some councils had any open data – but which?
Only some of those had a landing page for Open Data. Some had a portal. Some used their GIS systems.
Those that did provide data used different categories. There was no standardised schema.
For others, some had a landing page but then additional datasets were being found elsewhere on their websites
Contradictory licence references on pages – was it open or not?
We also looked to see if there was already a central hub of sorts upon which we could build. We found reference to Open Data on Scottish Cities Alliance website but couldn’t find any links to open data.
Curiosity then came into play, why were some councils prepared to publish some data and others so reluctant? What was causing the reluctancy? And for those publishing, why were all datasets not made open, what was the reason for selecting the ones they had chosen?
What we did
Our starting point was to create a file to allow us to log the source of data found. As a group, we decided upon headers in the file, such as the type of file, the date last updated to name but a few.
From previous CTC events which we attended we knew that Ian had put a lot of effort previously into creating a list of council datasets – IW’s work of 2019 and 2020which became our starting source. We also knew that Glasgow and Edinburgh were famous for having large, but very out of date, open data portals which were at some point simply switched off.
We were also made aware of another previous attempt from the end of 2020 to map out the cities’ open data. The screenshot below (Fig 1) is from a PDF by Frank Kelly of DDI Edinburgh which compared datasets across cities in Scotland. You can view the full file here.
Fig 1 From an analysis of Scottish Cities’s open data by Frank Kelly of DDI Edinburgh, late 2020 or early 2021
For some councils, we were able to pull in a list of datasets using the CKAN API. That worked best of all with a quick bit of scripting to gather the info we needed. If all cities, and other authorities did the same we’d have cracked it all in a few hours! But it appears that there is no joined up thinking, no sharing of best practices, no pooling of resources at play in Scotland. Surely COSLA, SCA, SOCITM and other groups could get their heads together and tackle this?
For others there were varying degrees of friction. We could use the arcGIS API to gather a list of data sets. But the arcGIS API tied us up in knots trying to get past the sign in process, i.e. did we need an account or could we use it anonymously – it was difficult to tell. Luckily with an experienced coder in our team we were able to make calls to the API and get responses – even if these were verbose and needed manual processing afterwards. This post from Terence Eden “What’s your API’s “Time To 200”?” is really relevant here!
For the rest it was a manual process of going into each city/council website and listing files. With three of us working on it for several hours. We succeeded in pulling together the datasets from the different sources into our csv file.
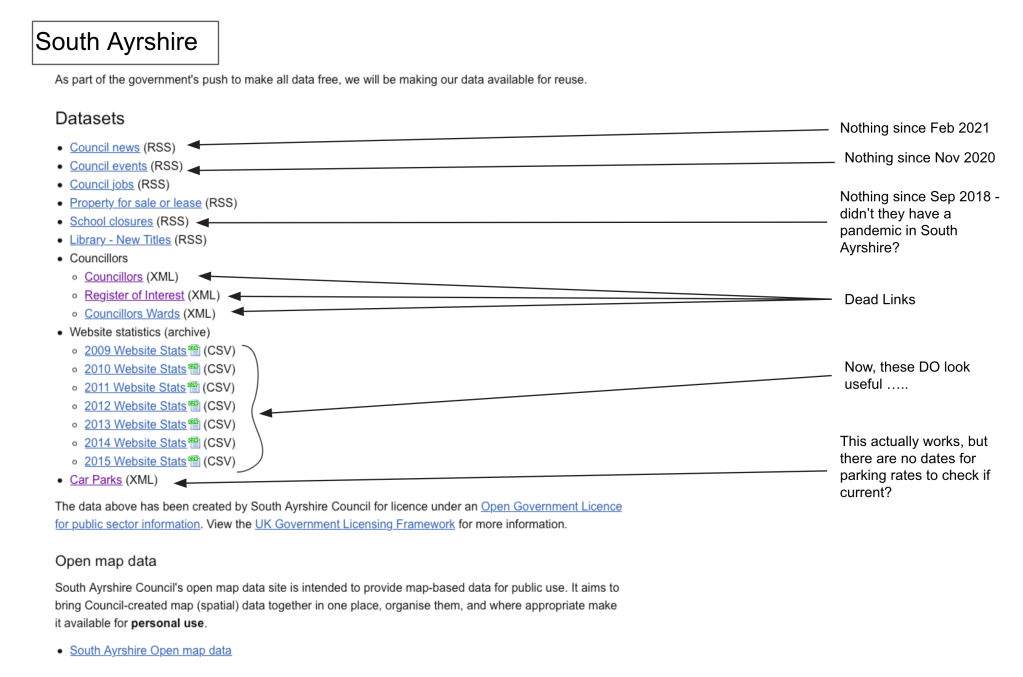
One council trying to publish open data but the quality, and the up-to-date-ness was questionable
Ultimately, the sources were so varied and difficult to navigate that it took 5 digitally-skilled individuals a full day, that is 30 man-hours, to pull this data together. Yet if we have missed any, as we are sure to have done, it may be because they have moved or are hidden away. Let us know if there are more.
From this output it became clear that there was no consistency in the types of files in which the data was being provided and no consistency in the refresh frequency. This makes it difficult to see a comprehensive view in a particular subject across Scotland (because there are huge gaps) and makes it difficult for someone not well versed in data manipulation to aggregate datasets, hence reducing usability and accessibility. After all, we want everyone to be able to use the data and not put barriers in the way.
We have a list, now what
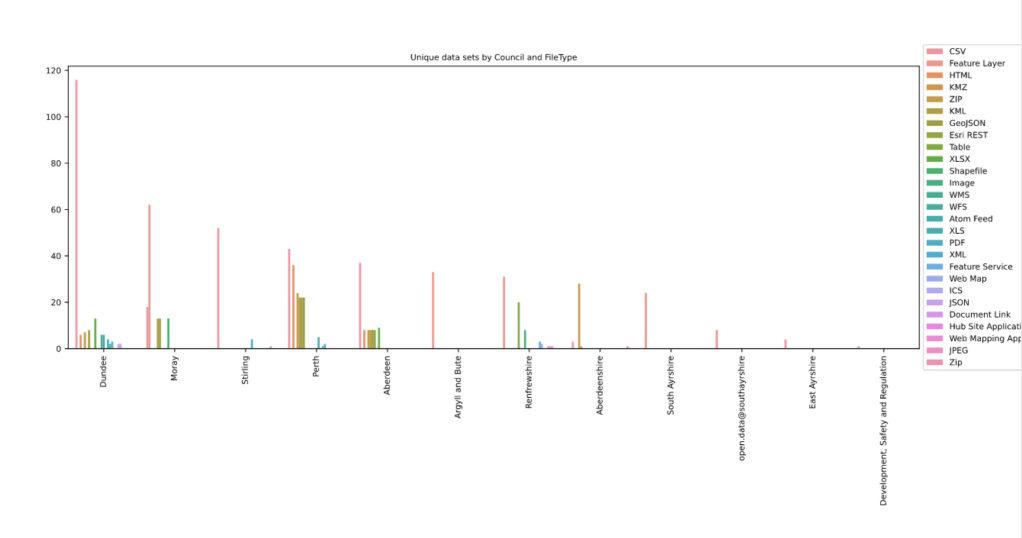
We now had a list of datasets in a csv file, so it was time to work on understanding what was in it. Using Python in Jupyter Notebooks, graphs were used to analyse the available datasets by file type, the councils which provided it, and how the data is accessed. This made it clear that even among the few councils which provide any data, there is a huge variation in how they do that. There is so much to say about the findings of this analysis, that we are going to follow it up with a blog post of its own.
Unique Datasets by CouncilUnique dattes by council and filetypeAverage filetypes provided for each data set by Council
One of our team also worked on creating a webpage (not currently publicly-accessible) to show the data listings and the graphs from the analysis. It also includes a progress bar to show the number of datasets found against an estimated number of datasets which could be made available – this figure was arbitrary but based on a modest expectation of what any local authority could produce. As you saw above, we set this figure much lower than we see from major cities on the continent.
What did we hope to achieve?
A one stop location where links to all council datasets could be found.
Consistent categories and tags such that datasets containing similar datasets could be found together.
But importantly we wanted to take action – no need for plans and strategies, instead we took the first step.
What next?
As we noted at the start of this blog post, Scotland’s approach Open Data is not working. There is a widely-ignored national strategy. There is no responsibility for delivery, no measure of ongoing progress, no penalty for doing nothing and some initiatives which actually work against the drive to get data open.
Despite the recognised economic value of open data – which is highlighted in the 2021 Digital Strategy but was also a driver for the 2015 strategy! – we still have those in government asking why they should publish and looking specifically to Scotland (a failed state for OD) for success stories rather than overseas.
We’ve seen closed APIs being, we assume, to try to measure use. We suspect the thinking goes something like this:
A common circular argument
In order for open data to be a success in Scotland we need it to be useful, usable, and used.
Useful
That means the data needs to be geared towards those who will be using it: students, lecturers, developers, entrepreneurs, data journalists, infomediaries. Think of the campaign in 2020 led by Ian to get Scottish Government to publish Covid data as open data, and what has been made of it by Travelling Tabby and others to turn raw data into something of use to the public.
Usable
The data needs to be findable, accessible, and well structured. It needs to follow common standards for data and the metadata. Publishers need to collaborate – coordinate data releases across all cities, all local authorities. ‘Things’ in the data need to use common identifiers across data sets so that they can be joined together, but the data needs to be usable by humans too.
Used
The data will only be used if the foregoing conditions are met. But government needs to do much more to stimulate its use: to encourage, advertise, train, fund, and invest in potential users.
The potential GDP rewards for Scotland are huge (est £2.21bn per annum) if done well. But that will not happen by chance. If the same lacklustre, uninterested, unimaginative mindsets are allowed to persist; and no coordination applied to cities and other authorities, then we’ll see no more progress in the next six years than we’ve seen in the last.
While the OGP process is useful, bringing a transparency lens to government, it is too limited. Government needs to see this as an economic issue as is the case, and one which the current hands-off approach is failing. We also need civic society to get behind this, be active, visible, militant and hold government to account. What we’ve seen so far from civic society is at best complacent apathy.
Scotland could be great at this – but the signs, so far, are far from encouraging!
Team OD Bods (Karen, Pauline, Rob, Jack, Stephen and Ian)
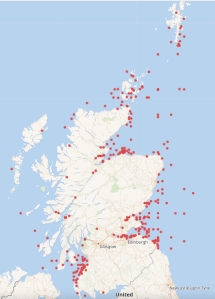
There are thousands of ship wrecks off the coast of Scotland which can be seen on Marine Scotland’s website
In Wikidata the position was quite different with only a few wrecks being logged. The information for the image below was derived from running the following query in Wikidata https://w.wiki/nDt
Day one – sourcing the information of the wrecks.
The project started by research various website to obtain the raw data required. Maps with shipwrecks plotted were found but finding the underlying data source was not so easy.
Once data was found, the next stage was finding out the licensing rights and whether or not the data could be downloaded and legitimately reused. The data found on Canmore’s website indicated that it was provided under an Open Government Licence hence could be uploaded to Wikidata. This is the data source which was then used on day two of the project.
A training session on how to use Wikidata was also required on day one to allow the team to understand how to upload the data to Wikidata and how the identifiers etc worked.
Day two – cleaning and uploaded the data to Wikidata.
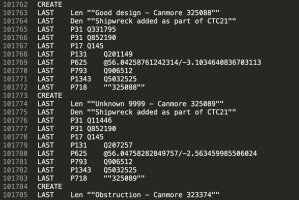
Deciding on the identifiers to use in Wikidata was the starting point, then the data had to be cleaned and manipulated. This involved translating Easting and Northings coordinates to latitude and longitude, matching the ship types between the Canmore file and Wikidata, extracting the reference to the ship from Canmore’s URL and general overall common sense review of the data. To aid with this work a Python script was created. It produced a tab separated file with the necessary statements to upload to Wikidata via Quickstatements.
The team members were new to Wikidata and were unable to create batch uploads as they didn’t have 4 days since creating their accounts and 50 manual edits to their credit – a safeguard to stop new accounts creating scripts to do damage.
We asked Ian from Code The City to assist, as he has a long editing history. He continues this blog post.
Next steps
I downloaded the output.txt file and checked if it could be uploaded straight to Quickstatements. It looked like there were minor problems with the text encoding of strings. So I imported the file into Google Docs. There, I ensured that the Label, Description and Canmore links were surrounded in double quotation marks. A quick find and replace did this.
I tested an upload of five or six entries and these all ran smoothly. I then did several hundred. That turned up some errors. I spotted loads of ships with the label “unknown” and every wreck had the same description. I returned to the Python script and tweaked it to concatenate the word “Unknown” with a Canmore ID. This fixed the problem. I also had to create a checking method of seeing if our ship had already been uploaded. I did this by downloading all the matching Canmore IDs for successfully uploaded ships. I then filtered these out before re-creating the output.txt file.
I then generated the bulk of the 24,185 to be uploaded. I noticed a fairly high error rate. This was due to a similar issue to the Unknown-named ships. The output.txt script was trying to upload multiple ships with the same names (e.g. over 50 ships with the name Hope). I solved this in the same manner as with Unknown-named wrecks, concatenating ship names with “Canmore nnnnnn.”
I prepared this even as the bulk upload was running. Filtering out the recently uploaded ships and re-running the creation of the Output.txt file meant that within a few minutes I was able to have the corrective upload ready. Running this a final time resulted in all shipwrecks being added to WIkidata, albeit with some issues to fix. This had taken about a day to run, refine and rerun.
The following day I set out to refine the quality of the data. The names of shipwrecks had been left in sentence case: an initial capital and everything else in lower case. I downloaded a CSV of records we’d created, and changed the Labels to Proper Case. I also took the opportunity to amend the descriptions to reflect the provenance of the records from Canmore in the description of each. I set one browser the task of changing Labels, and another the change to descriptions. This was 24,185 changes each – and took many hours to run. I noticed several hundred failed updates – which appear to just be “The save has failed” messages. I checked those and reran them. Having no means of exporting errors from Quickstatements (that I know of) makes fixing errors more difficult than it should be.
Finally I noticed by chance that a good number of records (estimated at 400) are not shipwrecks at all but wrecks of aircraft. Most, if not all, are prefixed “A/C’ in the label.
I created a batch to remove statements for ships and shipwrecks and to add statements saying that these are instances of crash sites. I also scripted the change to descriptions identifying these as aircraft wrecks rather than ship wrecks.
This query https://w.wiki/pjA now identifies and maps all aircraft wrecks.
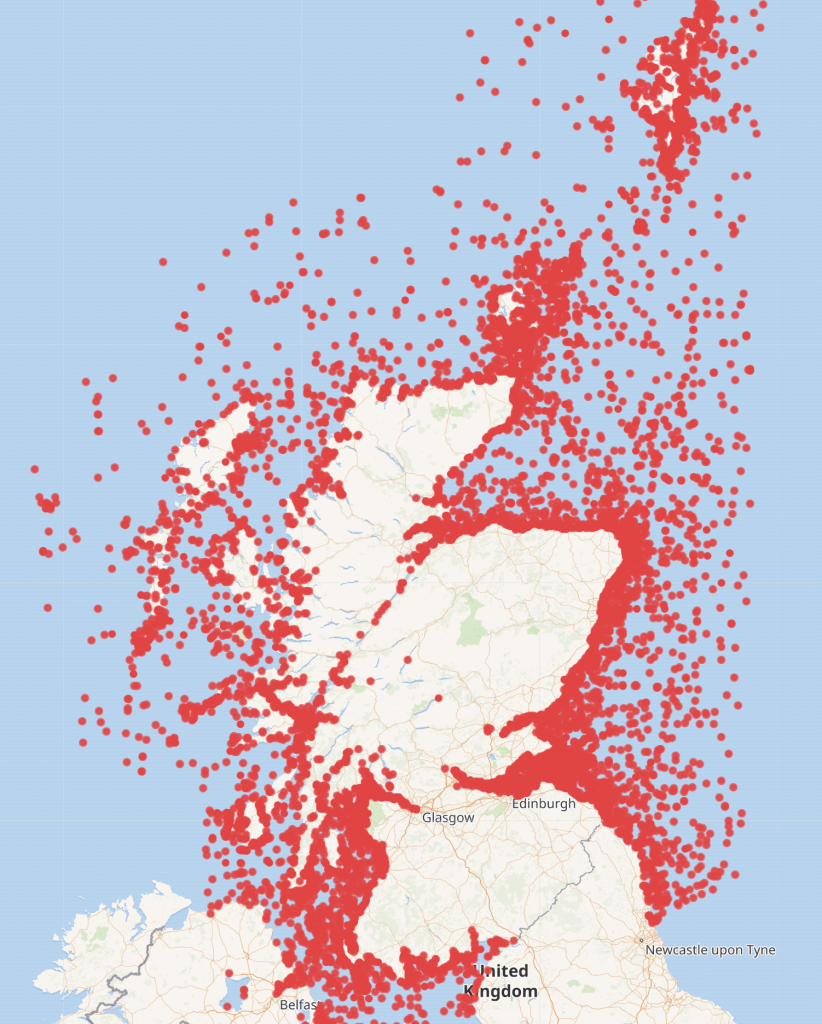
The location of all shipwrecks uploaded to Wikidata from Canmore.
Next steps?
I’ve noted the following things that the team could do to enhanced and refine the data further:
Check what other data is available by download or scraping from Canmore (such as date of sinking, depth, dimensions) and add that to the wikidata records
Attempt to reconcile data uploaded from Aberdeen built ships at CTC19 with these wrecks – there may be quite a few to be merged
Finally, in the process of working on the cleaning of this uploaded data I noticed the the data model on Wikidata to support this is not well structured.
This was what I sketched out as I attempted to understand it.
A confusing data model
Before I changed the aircraft wrecks to “crash site” I merged the two items which works with the queries above. But this needs more work.
Should the remains of a crashed aircraft be something other than a crash site? The latter could be cleared of debris and still be the crash site. The term Shipwreck more clearly describes where a wreck is whether buried, on land, or beneath the sea.
Why is a shipwreck a facet of a ship, but a crash site is a subclass of aircraft.
And Disaster Remains seems like the wrong term for what might be a non-disastrous event (say if a ship from the middle ages gently settled into mud over the centuries and was forgotten about – and certainly isn’t a subclass of Conservation Status, anyway.
I’d be happy to work with anyone else on better working out an ontology for this.