Code The City is a civic hacking initiative focused on using tech and (open) data for civic good. We use hack weekends, open data, workshops, and idea generation tools. We run Data Meetups, the Aberdeen Python User Group and the annual Scottish Open Data Unconference
At Code the City we believe that the right people, with the right skills and tools, can do great things. We believe that we can use technology and data to solve many civic challenges. Those beliefs are as applicable now as was when we started seven years ago. And our volunteers who come to our events time and again agree. They know that sharing their skills and knowledge with others in small teams, over a weekend, working on a focussed and achievable project, is a satisfying experience which leaves them with a sense of achievement. It also introduces them to working in teams and in an agile way: short sprints of work and pauses for review.
“The power of one, if fearless and focussed, is formidable, but the power of many working together is better” –
Gloria Macapagal Arroyo
In the last seven years we’ve tackled many topics – and worked with multiple partner organisations in the public and private sector to solve their challenges – and to identify opportunities to use data and technology to improve how they deliver their services.
Throughout that period we’ve had some central principles that we’ve adopted which still hold true:
Data, where appropriate, should be open and licensed for reuse
Software should be developed as open source – where the code can be inspected, and improved on by anyone, and reusable openly by others
Information, images and other content should be as openly licensed as possible to encourage re-use and creativity
Where appropriate stable platforms exist (such as WIkidata, Open Streetmap, Github,or Wiki Commons) we should use those
People working in small teams and in short sprints of activity can achieve an enormous amount over a weekend
Last week at Open UK’s COP26 event “Open Technology for Sustainability”, which our co-founder and trustee Ian Watt attended, those same principles that inspired our creation, and inform our continuing work, were echoed time and again by speakers. And at the evening awards dinner we were runners-up to the the wonderful Open Knowledge Foundation, in the Data category. This further validates our belief in our approach.
CTC’s Runner-up trophy for data in Open UK’s 2021 awards
More recently we’ve been concentrating even harder on improving open data in Scotland and the UK – but not to the exclusion of other projects. In addition to several history and heritage projects which have seen large amounts of open data created and published, we’ve had projects such as Open Wastemap which was built almost entirely over two CTC weekend and uses community-sourced data in Wikidata and OpenStreetmap to power this really useful tool to find local recycling facilities.
Our next event CTC24 – Open In Practice is taking place in just over a week. It is the perfect introduction to what we do and to becoming involved. We already have a list of potential projects that attendees, new and experienced, can get involved in. Some of these are local in scale and some national. All need a blend of skills from attendees. You don’t need to be either a coder or data expert to participate. You can sign up directly here or from the event link above.
No excuses: be part of the group that does the good things – or stand by and watch while we do!
In part oneof this blog post we explained the rationale of opening up the data from the Register of Returned Convicts of Aberdeen (1869-1939) . In this second part our intern for the summer project, Sara Mazzoli, explains our methodology and our results.
How we did it
Preparatory work: designing the Google Sheets
Having made the case to open the data we then designed a process for opening that data. We considered that Wikidata would be an ideal site to upload the records. Indeed, the data uploaded on Wikidata falls under the CC0 license, which allows individuals to share it and use it freely. Moreover, Wikidata allows individuals to freely query the data, and to apply visualisation and analysis techniques.
The process consisted of a few different steps, both for the opening of records and for the opening of convicts’ pictures – to which we will dedicate a separate paragraph. First, we designed two Google spreadsheets.
The first Google spreadsheet hosted the instructions for transcribing and checking the transcribed data, which we designed before the process began, as well as a table for the volunteers to sign up to either transcribe or check the records.
The other Google spreadsheet was divided into seven further sheets, one for each decade. To determine if one record pertained to one decade or the other, we took as reference the discharge date of the prisoners. Each row contained information on the transcription and checking (the person who transcribed the record; the person who checked the record; their eventual notes – e.g., outstanding information, illegible writing in the page to transcribe, etc.); link to the page of the register; page number) as well as the data of the Register’s page – which was: registered number of the convict; age on discharge; convict name and aliases; gender of the convict; complexion; eyes; hair; height (in imperial measurement); crime; sentence; sentence date; discharge date; distinguishing marks (such as tattoos, scars); address.
Once all the data was transcribed, we took two different processes to open the convicts’ data on Wikidata and to upload the isolated mug shots on Wiki commons.
Opening the convicts’ data: upload to Wikidata
Once all the data was transcribed, we decided to create another Google sheet, since it is easier to upload data on Wikidata through this platform. Here, we designed the look-up tables, and created formulas to translate the convicts’ details from natural language (English) to Wikidata properties and items’ codes (e.g., from “brown hair” to “P1884: Q2367101”, where “P1884” is the category for hair colour and “Q2367101” is brown).
Lookups of hair colours and QID codes
However, again, there were decisions we had to make:
Because metric measurement is more accurate and easier to understand, we designed a formula to translate the imperial measurement into metric.
Because distinguishing marks lacked a unique format, and because Wikidata needs some structure for the information that is uploaded to be machine-readable and to be queried; we decided not to upload the distinguishing marks.
As for the addresses, given that we wanted to visualize the addresses in a map, and noting all the addresses on the map would make it too cluttered, we have decided to just upload the first address for each individual.
Therefore, we created a Unique ID for all the items that we created so that they would be connected together. Also, we enriched the available information of the Register with the data collected by Phil Astley in his blog.
To upload the pictures, we created an Excel sheet to generate an automatic description for the pictures, using the available data from the register, as well as information from Phil’s blog. Once all the pictures were uploaded, we matched the picture(s) with the individual it was related to. Indeed, all Wikimedia services are related, and therefore it is easy to link a Wiki Commons image with a Wikidata item.
What we found out: results
Analysis of sentences: general
For the following visualizations, since they do not report the name of the convicts, we decided to make use of all the available data -, it was effectively possible to analyse the data from 278 records.
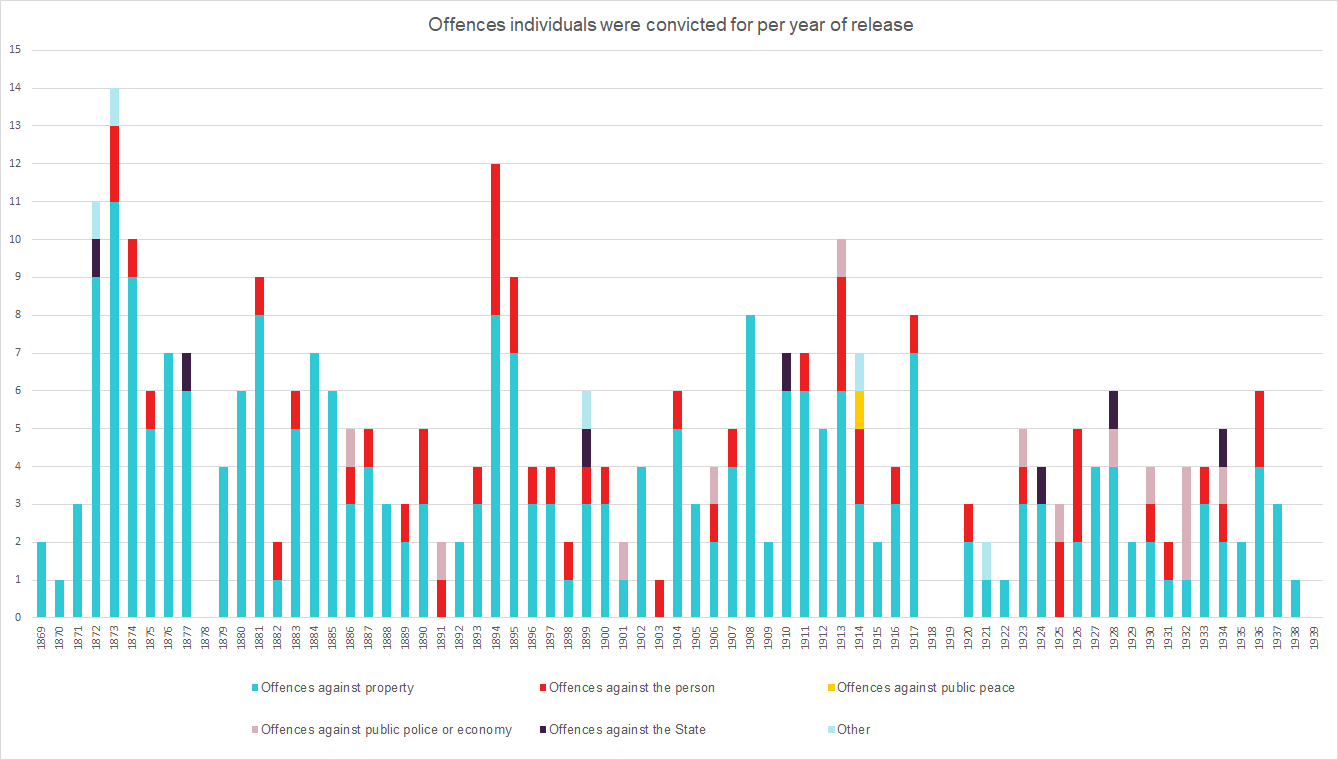
The graph below represents the number of convicts discharged every single year. Amongst these, it seems to us that there are 20 individuals who were probably sentenced to penal servitude twice, such as Elisabeth Wilson or Baxter. For all the data analysis, we decided to take as reference the date of discharge, rather than the sentence date. The reason for this lies in the fact that the sentence date was often not stated in the Register, while the date of discharge was always present. Therefore, it allows us to carry out a more meaningful and precise analysis.
It can be seen that, after the year 1904 (the year that splits the register in half), far less individuals were released. This means that most convictions happened in the early stages of the Register’s existence – and in particular during the 1860s, 1870s and 1880s. In fact, we counted 167 released individuals between 1869 and 1904, but only 111 individuals being released after 1904.
Another interesting feature, that can be seen here, is that no individuals were released in 1918 and 1919, as the Great War was raging.
If we look closer at the convictions, it is noticeable that all the sentences were penal servitudes (apart from one transportation, given in 1851). 83, however, are peculiar, since they included police supervision, hard labour, fortifying of license or fines.
Secondly, it is possible to see that a person could be convicted for more than one crime. For example, nine people were convicted for robbery and assault – that is why the number of offences is higher than the number of returned convicts, as it can be seen from the graph below. Moreover, each sentence could include “P.Cs” (i. e., previous convictions) and/or “hab & rep” (i. e., habit and repute – check the first blog post for more details).
Finally, three of the sentences given in the register were of penal servitude for life. All these three were given at the start of the twentieth century, and two of them were for crimes against the person (culpable homicide and murder). The third one was for attempting to “communicate information respecting H.M.Forces with the intention of assisting the enemy”. However, all these individuals were ultimately released within 1914 and 1931.
Because these sentences were given in the nineteenth and twentieth centuries, they did not respond to nowadays crime categories as much. For example, convictions of “abortion”, “sodomy” or “plagium” were hard to classify. Therefore, we decided to follow a classification of the time, first developed by Hume in 1797. Indeed, Hume wrote a very comprehensive work on the classification and cases within Scots Law, which better represents the crimes present in the register.
Categories:
Offences present in the Register pertaining to each category:
Offences against property
Theft (which can be aggravated by: habit and repute, housebreaking, shopbreaking, warehouse breaking), theft by opening lockfast places, embezzlement, plagium, larceny; reset; falsehood and fraud
Incest, bigamy, sodomy, indecency, removing a body from its grave
Offences against the State
Forgery of notes, uttering, Attempt to communicate information respecting H.M.Forces with the intention of assisting the enemy
Table 1: Offences as classified by Hume in 1797 (Hume, 1819). It is really fascinating to find out that plagium, which is still defined as a crime of “child stealing”, is classified as an offence against property; the rationale being that “the creature taken, which has no will on its own, is a thing” (Hume, 1819, p. 82).
Of course, this classification cannot be employed uncritically, as it reflects a view of the world on crime, justice, morality and human nature. Grasping this view of the world is impossible for us, but it is interesting to reflect on it and the impacts that it may still hold on the way we see and experience crime. Therefore, in suggesting that the offences in the Register are classified according to these categories, we do not aim to justify these classifications; but rather to frame those offences in the moral and social paradigms in which they belong to. As claimed by Pauw (2014, p. 9), “Crime history can provide insight into the social response to crime. In terms of social history, the study of crime provides perspective on society’s definition and expectations for moral behavior”. From this point of view, the category of “Offences against public police or economy” is quite exemplary. In fact, it comprehended all offences that went against “propriety, good neighbourhood and good manners”.
Therefore, as we also stressed in the first blogpost, it is important to underline that such classifications, despite having real effects on individuals, are constructed – and thus can and must be framed and questioned.
Taking a closer look at the offences for which individuals were convicted, it is evident that the vast majority were accused of crimes against
Property. The total number of offences against property were 246. In comparison, the number of offences against the person was just 50, and those against public police or economy were 12. The offences pertaining to the other two classes of crimes, summed together, account for less than 10 crimes. There were moreover a few sentences that we could not classify, such as “Military striking a superior officer”.
It is interesting to notice that, while most offences for other categories seem quite scattered through the register, most of convictions against public police or economy were mainly given within the last few years of the Register’s existence.
Analysis of sentences: averages and medians
With the aim of understanding how the sentences length changed over the decades, to understand if we could find out any particular pattern; we calculated the average sentence length given for each crime category, both before 1904 and after 1904. This is because the data on charges for crimes against property is the only one which allows a more granular and detailed analysis and confrontation of sentences from decade to decade.
Due to the fact that, as mentioned above, 84 sentences were containing other pieces of information (such as hard labour, police supervision, etc.), these sentences could not be included in the calculation of the average. Also, in this case, as for the mixed sentences, such as the above-mentioned “Assault & Robbery”, we could not determine whether the sentence length could be equally splitted between the two charges, and therefore decided to pair them together with “Other” in this analysis.
Point in time
Against property
Against the person
Against public peace
Against public police or economy
Against the State
Other and mixed sentences
Convicts released before 1904
Number of sentences per type of crime
109
17
–
3
2
12
Average sentence length (years)
6.55
7.94
–
8.33
6.5
6.33
Median sentence length (years)
7
7
–
5
6.5
5
Convicts released after 1904
Number of sentences per type of crime
64
16
1
10
2
7
Average sentence length (years)
4.57
7.5
3
4.4
12.5
5.71
Median sentence length (years)
5
5
3
4
12.5
5
Table 2: statistics on sentence length for each class of crimes, divided by point in time.
In general, sentence length for individuals released after 1904 was a bit lower compared to the penalty received by individuals released before. Calculating the average sentence length for the sentences given before 1904 (where it was possible to calculate it), we found out that convicts were, on average, sentenced to 6.73 years in prison. After 1904, that number reduced to 5.26 years. It seems that most of it has to do with shorter punishments for crimes against property, which were the vast majority and which average length for crimes against property significantly decreased for individuals released after 1904.
For crimes against the person after 1904, we see an average sentence length of 7.81 years, contrasted by a median length of 5. For convicts released before 1904 who committed a crime against the person, usually a sentence of 5 years or more was given, and thus sentences were more homogeneous – and therefore, median and average are similar. Instead, for those convicted of crime against the person released after 1904, there were four harsher sentences to 10 years or more (including the two penal servitudes for life, which lasted 15 and 30 years), and eleven sentences that lasted 5 years or less. A similar thing is true for crimes against public police or economy before 1904; where amongst those three sentences given, two were 5 years long and one, for incest, 15 years long.
Analysis of gender and age data
Amongst these 278 records that we could analyse, we found out that 37 convicts were women. Most of them were convicted for crimes against property, mostly theft. There were four however, who were convicted for a crime against the person – all of them for culpable homicide in 1886, 1893, 1923, 1929. When analysing the data for gender, it is apparent that most of women were convicted in the second half of the nineteenth century, being most of them discharged between 1869 and 1893.
In terms of how the average age of female convicts compares to male convicts, as well as to how the average sentence length given to women compares with that of male convicts; there are no apparent significant differences.
Point in time
Average age on discharge
Average sentence
Female
Male
Female
Male
Convicts released before 1904
44
39
7.5
7.03
Convicts released after 1904
39
40
3.67
5.17
Table 3: statistics on sentence length and age, divided by gender and by point in time.
Analysis of addresses data
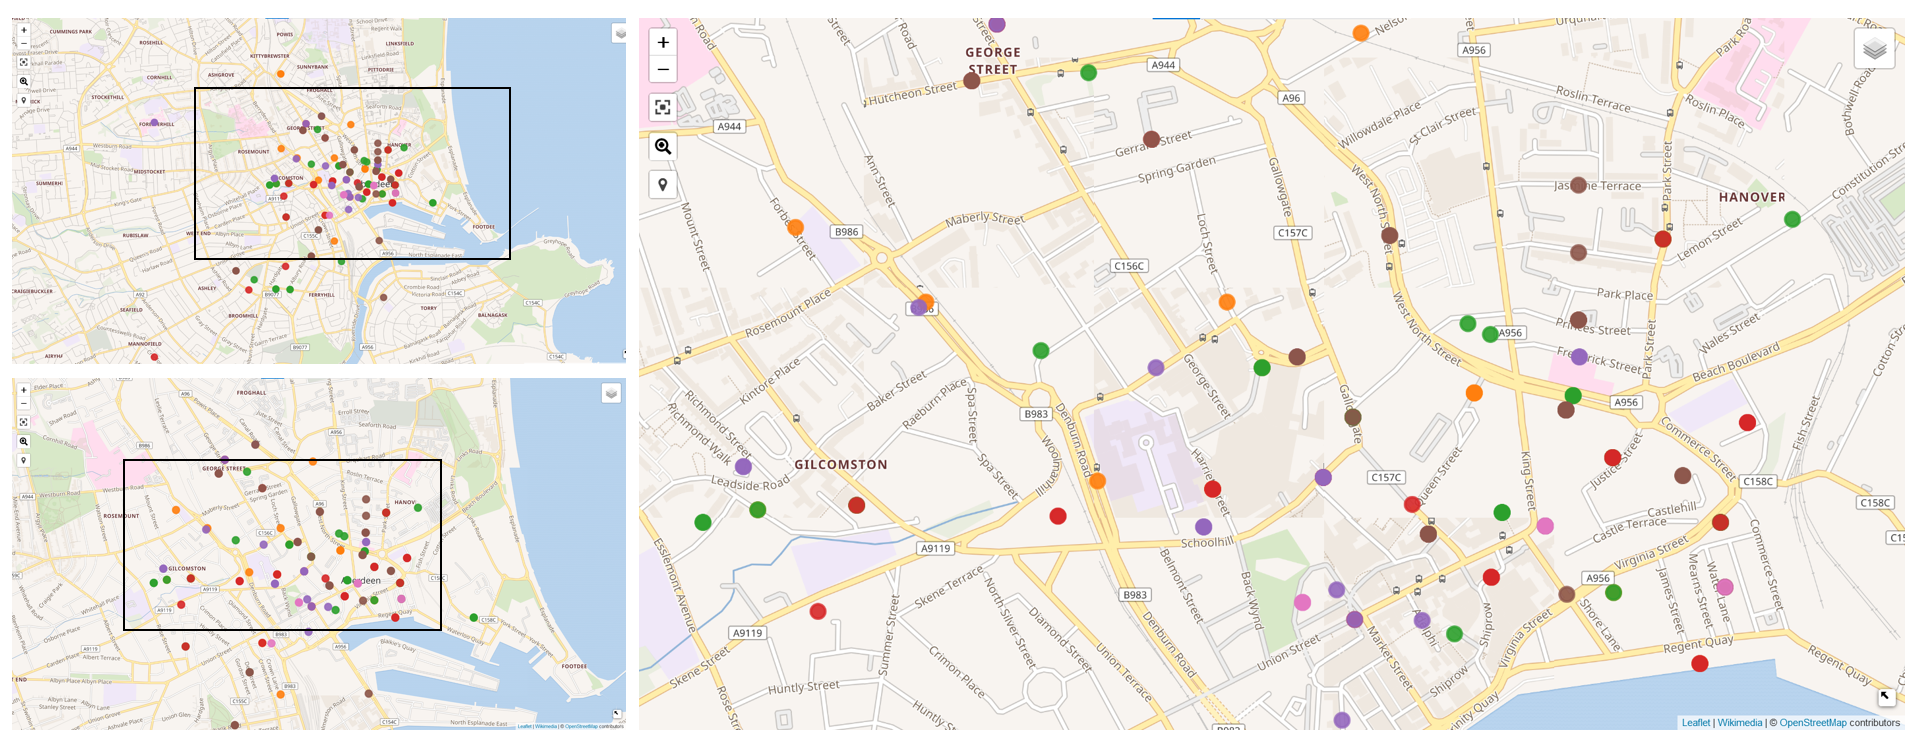
The map with the addresses was developed by Ian, and can be seen here. This visualization was created through the Wikidata queries service, and is based on the data we have currently uploaded on Wikidata. Thus, it is based on records of individuals discharged between 1869 and 1921.
Fig 1: Map with the addresses to which convicts returned. The first view on the right comprehends the whole Aberdeen urban area, while the second one below it is more focussed on the city (the represented area is that inside the black square in the first picture). The third represents Aberdeen’s city centre, where most convicts returned to (the represented area is that inside the black square in the second picture).
The yellow dots represent the address of convicts released in 1870s, the green ones is for the addresses of those who were released in 1880s, the red ones are for the addresses of those who were released in 1890s, the purple ones is for the addresses of those who were released in 1900s, the brown ones are for the addresses of those who were released in 1910s, the pink ones are for the addresses of those who were released in 1920s.
According to Smith (2000, p. 22), in 1708 Aberdeen had 5000 inhabitants. By 1800, that figure quintupled, but the city’s borders remained unchanged: “the boundaries at the time were defined by the Denburn Valley to the west, the south end of the Spital (now St Peter Street) to the north, and the tidal estuary of the River Dee to the south. […] This growth [in population] had been accommodated primarily by the infill of open space thus greatly increasing the density of the urban population”. Therefore, Aberdeen’s council decided on a plan to expand the city towards the Western areas of the Denburn valley, thereby building Union Street – which project started in 1799.
The construction of Union Street redefined the geography and the social composition of the city. While at the start of the nineteenth century, the poor and the rich more or less shared the same urban space; with the expansion of the city towards the West, the middle and upper classes moved to the newly built suburbs. The working class was thus left to live in the city centre, often in squalid and unsanitary conditions, in slum-like housing. Indeed, despite the economic prosperity experienced by the city during the second half of the nineteenth century, the living condition of the working class did not improve (Williams, 2000).
In fact, according to Williams (2000), despite the widespread poverty amongst the working classes, caused by low wages, the local government hardly ever intervened before the twentieth century. Indeed, in Victorian times, poverty was generally seen as a choice, rather than the result of social forces; and thus public intervention was not seen as a possible solution. The Victoria Lodging-House, in which 19 convicts resided as their first address – previously a residence known as Provost Skene – was opened as a result of philanthropic action, rather than from governmental initiative. The first municipal attempts to solve the housing crisis and to clear the slums are to be found at the very end of the nineteenth century and at the start of the twentieth, with the appointment of Matthew Hay as the medical officer of health. Hay denounced the conditions in which the poor lived, and suggested improving the most critical areas for the general public health interest. Therefore, the government built the Corporation Lodging House in East North street in 1899, where 17 convicts resided as their first address. It also started closing uninhabitable dwellings. More systematic attempts to overcome the indigent conditions in which the poor lived started in the Twenties, in which, for example, Guestrow was cleared. In total, the people in the Register that lived in Guestrow as their first address were 31, with the last moving there in 1913.
The high concentration of former convicts in the areas of Castlehill and Castlegate therefore may suggest that most of them lived in such conditions, and were belonging to the working class. Therefore, they might have lived in conditions of extreme poverty. This could also explain why the rate of crimes against property, which patterns usually change according to the economic cycle, remained quite high during the second half of the nineteenth century; despite Aberdeen’s economy increasing during that period.
Reflections on the project
All in all, this project has been incredibly interesting and stimulating. It represented a chance to dive into the history of Aberdeen, explore social Victorian practices, and understand and work with a platform such as Wikidata. Indeed, it was fascinating to see, for example, the way in which convicts were described. We could notice the widespread presence of tattoos, and even the presence of vaccination marks after the 1880s.
Part of the reason why the project was so stimulating, and represented an occasion to learn so much, lies in the complexity of the project itself. We had to make decisions at every stage of the project, we had to design spreadsheets and formulas, and employ tools which we had never before – and that required quite a bit of trial and error. To me, it was an occasion to understand how Wikidata, a platform born in 2012, works, and what are its potentials.
Since its foundation, Wikidata has since grown with projects like this one. In fact, as Ian told me, the project has been a great occasion to also help shape and change Wikidata’s way to categorize convictions. Indeed, the way in which data can be stored in the platform is quite flexible and fairly easy to change.
Many scholars, activists and Wikimedians have highlighted the possibilities unfolded by the opening data using Wikidata. For example, Evans (2017) has claimed that Wikidata can provide better access to datasets, and can better connect collections together. In fact, being just one platform, it potentially allows for the datasets’ items to be linked also with other items in other datasets. Therefore, Wikidata can be defined as a platform to publish linked open data (LOD), and as such can provide us with more insights on the data compared to a single institution’s website (Allison-Cassin & Scott, 2018) – since that website probably does not offer the same possibility of linking the institution’s data with that of other institutions.
Furthermore, as Ian explained to me, employing Wikidata is free, and thus far less costly than maintaining an institution’s website on which to open the data. Indeed, there is a very small risk of Wikidata being closed, as it is with any site, but the datasets on the platform can always be downloaded and backed up, and this risk is much lower than a project website set up by a local authority whose funding may be cut in future. Therefore, Wikidata can potentially represent a great opportunity for the GLAM sector, which data is so crucial to understand the history of the places where we live in. Of course, I would argue that this data must be framed and contextualized, and the choices that were made must also be made as transparent as possible. Also, it is noticeable that there are limits to which data can be opened, and how. Since the data to be opened still requires some uniform formatting, it was not possible for us to open the distinguishing marks yet. Nonetheless, for the GLAM sector Wikidata can represent an occasion to engage with the local community, and to co-create meaningful projects.
Ultimately, on this note, we want to thank once again the volunteers who took some time to help us with the project. We couldn’t have done it without your kind collaboration.
References
Allison-Cassin, S., & Scott, D. (2018). Wikidata: a platform for your library’s linked open data. Code4Lib Journal, (40).
Evans, J. [Wikimedian in Residence – University of Edinburgh]. (2017, November 7). Wikidata loves Galleries. Libraries, Archives & Museums – Jason Evans, National Library of Wales [Video]. YouTube. https://www.youtube.com/watch?v=qf6OG2QTvT4&t=1406s
Hume, D. (1819). Commentaries on the Law of Scotland, Vol. 1
Pauw, E. (2014). Reports of Criminality: The Aberdeen Journal and the Presentation of Crime, 1845-1850 (Doctoral dissertation).
Smith, J. S. (2000). The Growth of the City. In Aberdeen, 1800-2000: A New History (pp. 22-46). Tuckwell Press.
Williams, N. J. (2000). Housing. In Aberdeen, 1800-2000: A New History (pp. 295-322). Tuckwell Press.
Saturday 6th March, 2021 was World Open Data Day. To mark this international event CTC ran a Wikidata Taster session. The objectives were to introduce attendees to Wikidata and how it works, and give them a few hours to familiarise themselves with how to add items, link items, and add images.
Presentation title screen
The theme of the session (to give it some structure and focus) was the Industrial Heritage of Aberdeen. More specifically the bygone industries of Aberdeen and, more specific still, the many Iron Foundries that once existed. I chose the specific topic as it is still relatively easy to spot the products of the industry on streets and pavements as we walk around the city, photograph those and add them to Wiki Commons, as I have been doing.
We had thirteen people book and eight turn up. After I gave a short presentation on how Wikidata operates we divided ourselves into three groups in breakout rooms. This was all on Zoom, of course, while we were still under lockdown.
The teams of attendees chose a foundry each: Barry, Henry & Cook Limited; Blaikie Brothers, and William McKinnon & Company Ltd. I’d already created an entry for John Duffus and Company in preparation for the event and to use as a model.
I’d also created a Google Sheet with a tab for each of the other thirteen foundries I’d identified (including those selected by the groups). I’d also spent quite a while trying to figure out how to access and search the old business and Post Office Directories for the city which had been digitised for 1824 to 1941. I eventually I built myself a tool, which I shared with the teams, which generated an URL for a specific search term for a certain directory. They used this, as well as other sources, to identify key dates, addresses and name changes of businesses.
By the end of the session our teams had created items for
They had also created items for foundry buildings – linked to Canmore etc, as well as founders. We enhanced these with places of their burial, portraits and images of gravestones. I took further photos which I uploaded to Commons and linked the following Monday. I created two Wikidata queries to show the businesses added, and the founders who created the businesses.
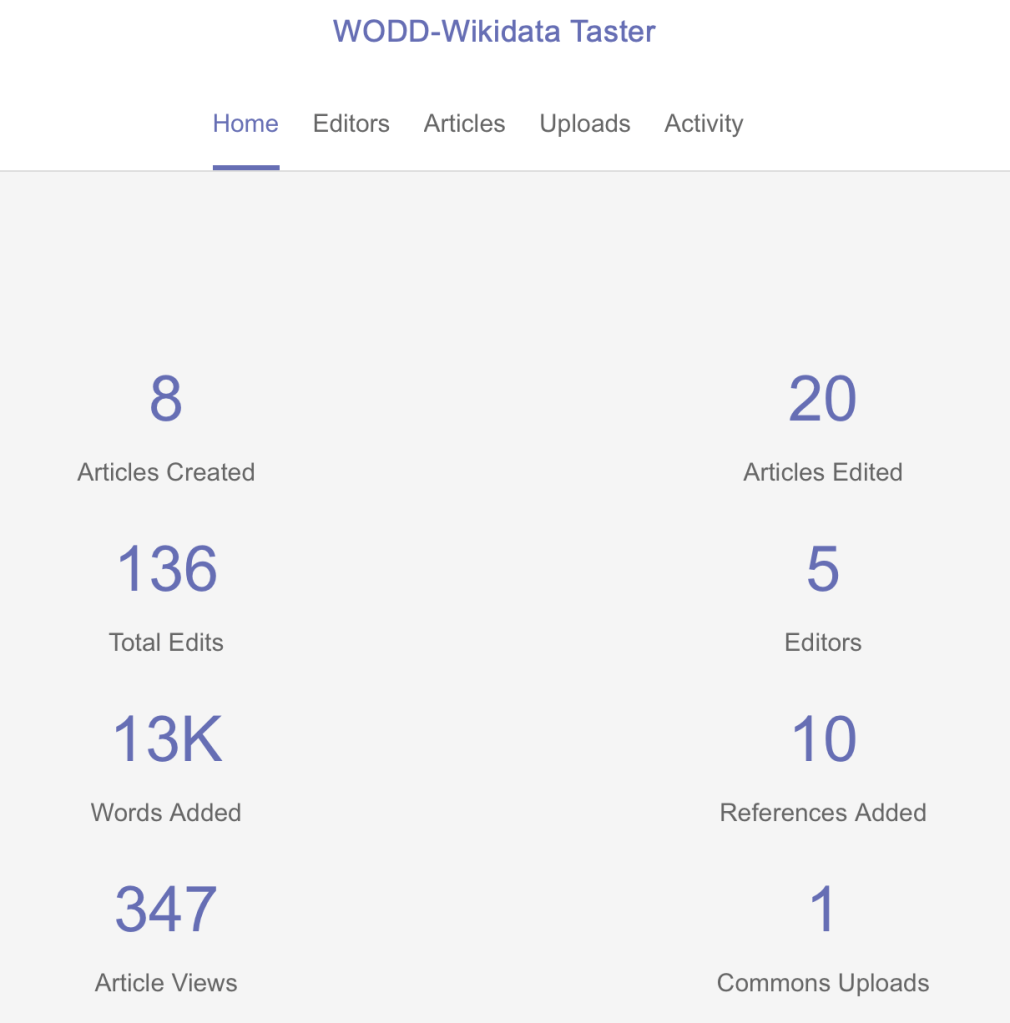
The statistics for the 3 hour session (although some worked into the afternoon and even the next day) are impressive. You can see more detail on the event dashboard.
We received positive feedback from the attendees who have been able to take their first steps towards using Wikidata as a public linked open data for heritage items.
I hope that the attendees will keep working on the iron founders until we have all of these represented on Wikidata. Next we can tackle shipbuilders and the granite industry!
One of the Code the City 21 projects was looking at providing Scots translations of Aberdeenshire place names for displaying on an OpenStreetMap map. Part of the outcomes for that project included a list of translated places names and potentially an audio version of name to guide in pronunciation.
I’m a firm believer that Open Data shouldn’t just become “dusty data left on the digital shelf” and to “show don’t tell”. This led me to decide to show just how easy it is to do something with the data created as part of the weekend’s activities and to make use of outcomes from a previous CTC event (Aberdeenshire Settlements on Wikidata and Wikipedia) and thus take that data off the digital shelf.
My plan was to build a simple iOS app, using SwiftUI, that would allow the following:
Listing of place names in English and their Scots translation
View details about a place including its translation, location and photo
Map showing all the places and indicating if a translation exists or not
I used SwiftUI as it is fun (always an important consideration) to play with and quick to get visible results. It also provides the future option to run the app as a Mac desktop app.
Playing along at home
Anyone with a Mac running at least Catalina (macOS 10.15) can install Xcode 12 and run the app on the Simulator. The source code can be found in GitHub.
Getting the source data
Knowing that work had previously been done on populating Wikidata with a list of Aberdeenshire Settlements and providing photos for them, I turned to Wikidata for sourcing the data to use in the app.
# Get list of places in Aberdeenshire, name in English and Scots, single image, lat and long


SELECT  ?place (SAMPLE(?place_EN) as ?place_EN) (SAMPLE(?place_SCO) as ?place_SCO) (SAMPLE(?image) as ?image) (SAMPLE(?longitude) as ?longitude)  (SAMPLE(?latitude) as ?latitude)
  WHERE {
    ?place wdt:P31/wdt:P279* wd:Q486972 .
    ?place wdt:P131 wd:Q189912 .
    ?place p:P625 ?coordinate.
    ?coordinate psv:P625 ?coordinate_node .
    ?coordinate_node wikibase:geoLongitude ?longitude .
    ?coordinate_node wikibase:geoLatitude ?latitude .
    OPTIONAL { ?place wdt:P18 ?image }.
    OPTIONAL { ?place rdfs:label ?place_EN filter (lang(?place_EN) = "en" )}.
    OPTIONAL { ?place rdfs:label ?place_SCO filter (lang(?place_SCO) = "sco" )}.
    }
GROUP BY ?place
ORDER By ?place_EN
Single image for the place (some places have multiple images so had to be restricted to single image)
Latitude of place
Longitude of place
Just requesting the coordinate for each place resulted in a text string, such as Point(-2.63004 57.5583), which complicated the use later on. Adding the relevant code
to the query to generate latitude and longitude values simplified the data reuse at the next stage.
The results returned by the query were exported as a JSON file that could be dropped straight into the Xcode project.
The App
SwiftUI allows data driven apps to be quickly pulled together. The data powering the app was a collection of Place structures populated with the contents of the JSON exported from Wikidata.
struct Place: Codable, Identifiable {
     let place: String
     let place_EN: String
     let place_SCO: String?
     let image: String?
     var latitude: String
     var longitude: String

     // Computed Property
     var id: String { return place }
     var location: CLLocationCoordinate2D {
         CLLocationCoordinate2D(latitude: Double(latitude)!, longitude: Double(longitude)!)
     }
 }
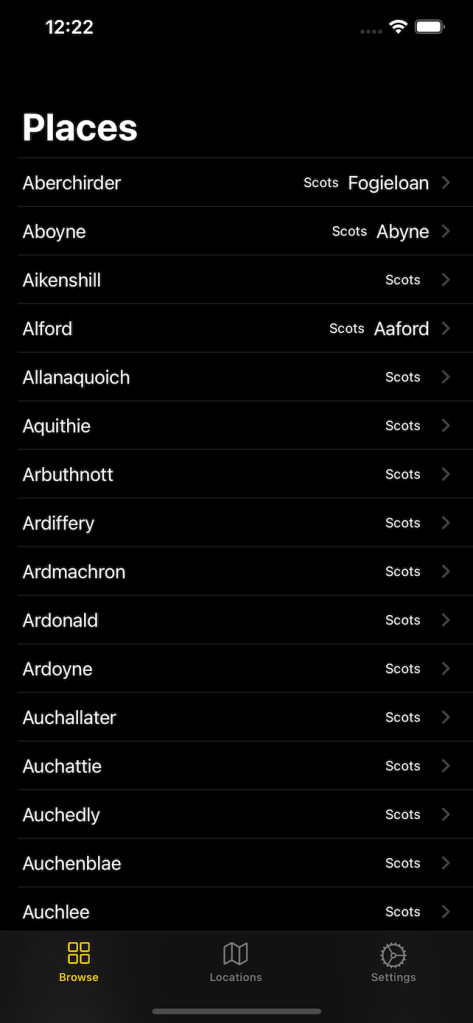
The app itself was split into three parts: Places list, Map, Settings. The Places list drills down to a Place details view.
List of places in English and their Scots translation if included in the dataDetails screen about a placeMap showing places and indicating if they have Scots translation (yellow) or not (red)
The Settings screen just displays some about information and where the data came from. It acts partially as a placeholder for now with the room to expand as the app evolves.
Next Steps
The app created over the weekend was very much a proof of concept and so has room from many improvements. The list includes:
Caching the location photos on the device
Displaying additional information about the place
Adding search to the list and map
Adding audio pronunciation of name (the related Doric Tiles project did not achieve adding of audio during the CT21 event)
Modified to run on Mac desktop
Ability to requested updated list of places and translations
The final item on the above list, the ability to request an updated list of places, in theory is straight forward. All that would be required is to send the query to the Wikidata Query Service and process the results within the app. The problem is that the query takes a long time to run (nearly 45 seconds) and there may be timeout issues before the results arrive.
“Hear me calling, hear me calling loud, If you don’t come soon, I’ll be wearing a shroud.” – Ten Years After (1969)
Introduction
Today marks the tenth anniversary of my involvement with Open Data in Scotland. As I wrote here, back in 2009-2010 I’d been following the work that Chris Taggart and others were doing with open data, and was inspired by them to create what I now believe to have been the first open data published in the public sector in Scotland.
This piece is a reflection of my own views. These views may be the same as those held by colleagues at Code The City or indeed on the civic side of the Open Government Partnership. I’ve not specifically asked other individuals in either group.
While my involvement in, and championing of, open data in Scotland is now a decade long, my enthusiasm for the subject and in the the social and economic benefits it can deliver, is undiminished by my leaving the public sector in 2017 after thirty four years. In fact the opposite is true: the more I am involved in the OD movement, and study what is being achieved beyond Scotland’s narrow borders, the more I am convinced that we are a country intent on squandering a rich opportunity, regardless of our politicians’ public pronouncements.
But the journey has not been easy. primarily due to a lack of direction from Scottish Government and little commitment, resource or engagement at all levels of public service. A friend who reviewed this blog post suggested that I should replace the picture of a birthday cake (above) with one of a naked human back bearing bleeding scars from the our battles. He’s right – it is STILL a battle ten years on.
It is not as if the position in Scotland is getting better. We are moving at a glacial pace. The gap between Scotland and other countries in this regard is widening. I gave a talk earlier this year in which I showed assessments of Scotland, Romania and Kenya’s performance in Open Government (source: https://www.opengovpartnership.org/campaigns/global-report/ Vol 2) and asked the audience to identify which was Scotland.
Extracts from Vol2 to of the Open Gov Partnership report
In February 2020 the European Data Portal published a report – The Economic Impact of Open Data – which sets out a clear economic case for open data. That paper looks at 15 previous studies between 1999 and 2020 which have examined at the market size of open data at national and international levels, measured in terms of GDP of each study’s geographical area.
Taking the average and median values from those reports (1.33% and 1.19% respectively) and an estimated GDP for Scotland (2018) of £170.4bn we can see that the missed opportunity for Scotland is of the order of £2.027bn to £2.266bn per annum. What is the actual value of the local market created by Scottish-created open data? if pushed for a figure I would estimate that it is currently worth a few hundred thousand pounds per annum, and no more. Quite a gap!
Meantime we have the usual suspect of consultants whispering sweetly in the ears of ministers, senior civil servants and council bosses that we should be monetising data, creating markets, selling it. There will be no mention, I suspect of the heavily-subsidised, private sector led, yet failed Copenhagen Data Exchange, I suspect. (Maybe they can make a few bob back selling the domain name! )
You can buy the failed CityDataExchange.com for just $5195
While this commercial approach to data may plug small gaps in annual funding for Scotland, and line the pockets of some big companies in the process, it won’t deliver the financial benefits at a national level of anything like the figures suggested by that EU Data Portal report but it will, in the process, actively hamper innovation and inhibit societal benefits.
I hear lots of institutions saying “we need to sell data” or “we need to sell access rights to these photos” or similar. Yet, in so many cases, the operation of the mechanisms of control; the staffing, administration, payment processing etc. far outstrips any generated income. When I challenged ex colleagues in local government about this behaviour their response was “but our managers want to see an income line” to which we could add “no matter how much it is costing us.” And this tweet from The Ferret on Tuesday of this week is another excellent example of this!
I have also heard lots of political proclamations of “open and transparent” government in Scotland since 2014. Yet most of the evidence points in exactly the opposite direction. Don’t forget, when Covid 19 struck, Scotland’s government was reportedly the only political administration apart from Bolsonaro’s far right one in Brazil to use the opportunity to limit Freedom of Information.
Openness, really?
It is clear that there is little or no commitment to open data in any meaningful way at a Scottish Government level, in local authorities, or among national agencies. This is not to say that there aren’t civil servants who are doing their best, often fighting against political or senior administration’s actions. Public declarations are rarely matched by delivery of anything of substance and conversations with people in those agencies (of which I have had many) paints a grim picture of political masters saying one thing and doing another, of senior management not backing up public statements of intent with the necessary resource commitment and, on more than occasion, suggestions of bad actors actually going against what is official policy.
I mention below that I joined the Open Government Partnership late in 2019. Initially I was enthusiastic about what we might achieve. While there are civil servants working dedicatedly on open government who want to make it work, I am unconvinced about political commitment to it. We really need to get some positive and practical demonstration that Scottish Government are behind us – otherwise I and the other civil society representatives are just assisting in an open-washing exercise.
In my view (and that of others) the press in Scotland does not provide adequate scrutiny and challenge of government. We have a remarkably ineffective political opposition. We also have a network of agencies and quangos which are reliant on the Scottish Government for funding who are unwilling to push back. All of this gives the political side a free pass to spout encouraging words of “open and transparent” yet do the minimum at all times.
We may have an existing Open Data Strategy for Scotland (2015) stating that Scotland’s data is “open by default”, yet my 2019 calculation was that over 95% of the data that could and should be open was still locked up. And there is little movement on fixing that.
We have many examples of agencies doing one thing and saying another, such as Scottish Enterprise extolling the virtues of Open Data yet producing none. Its one API has been broken for many months, I am told.
My good friends at The Data Lab do amazing work on funding MSc and Phd places, and providing funding for industrial research in the application of data science. Their mission is “to help Scotland maximise value from data …” yet they currently offer no guidance on open data, no targeted programme of support, no championing of open data at all, despite the widely-accepted economic advantages which it can deliver. There is the potential for The Data Lab to lead on how Scotland makes the most of open data and to guide government thinking on this!
All of this is not to pick on specific organisations, or hard working and dedicated employees within them. But it does highlight systemic failures in Scotland from the top of government downwards.
Fixing this is an enormous task: one which can only be done by the development of a fresh strategy for open data in Scotland, which is mandated for all public sector bodies, is funded as an investment (recognising the economic potential), and which is rigorously monitored and enforced.
I could go on…. but let’s look at this year’s survey.
In February 2019 I conducted a survey of the state of open data in Scotland. It didn’t paint an encouraging picture. The data behind that survey has been preserved here. A year on, I started thinking about repeating the review.
In the intervening year I’d been involved in quite a bit activity around open data. I had
joined the civic side of the Open Government group for Scotland and was asked to lead for the next iteration of the plan on Commitment Three (sharing information and data) ,
joined the steering group of Stirling University’s research project, Data Commons Scotland,
trained as a trainer for Wikimedia UK, delivering training in Wikidata, Wikipedia and Wiki Commons, and running multiple sessions for Code The City with a focus on Wikidata,
created an open Slack Group for the open data community in Scotland to engage with one another,
created an Open Data Scotland twitter account which has gained almost 500 followers, and
In restarting this year’s review of open data publishing in Scotland my aims were to see what had changed in the intervening 12 months and to increase the coverage of the survey: going broader and deeper and developing an even more accurate picture. That work spilled into March at which point Covid-19 struck. During lockdown I was distracted by various pieces of work. It wasn’t until August, and with a growing sense of the imminence of this 10-year anniversary, that I was galvanised to finish that review.
I am conscious that the methodology employed here is not the cleverest – one person counting only the numbers of datasets produced. This is something I return to later.
The picture in 2020
I broke the review down into sectoral groupings to make it more managable to conduct. By sticking to that I hope to make this overview more readable. The updated Git Hub repo in which I noted my findings is available publicly, and I encourage anyone who spots errors or omissions to make a pull request to correct them. Each heading below has a link to the Github page for the research.
Overall there is little significant positive change. This is one factor which gives rise to concerns about government’s commitment to openness generally and open data specifically; and to a growing cynicism in the civic community about where we go from here.
I reviewed this area in February 2020 and rechecked it in August. Sadly there has been no significant change in the publication of open data by local government in the eighteen months since I last reviewed this. More than a third of councils (13 out of a total of 32) still make no open data provision.
While the big gain is that Renrewshire Council have launched a new data portal with over fifty datasets, most councils have shown little or no change.
Sadly the Highland Council portal, procured as part of the Scottish Cities Alliance’s Data Cluster programme at £10,000’s cost, has vanished. I dont think it ever saw a dataset being added to it. Searching Highland Council’s website for open data finds nothing.
While big numbers of data sets don’t mean much by themselves, the City of Edinburgh Council has a mighty 236 datasets. Brilliant! BUT … none of them are remotely current. The last update to any of them was September 2019. Over 90% of them haven’t been updated since 2016 or earlier.
Similarly Glasgow, which has 95 datasets listed have a portal which is repeatedly offline for days at a time. A portal which won’t load is useless.
Dundee, Perth and Stirling continue to do well. Their offerings are growing and they demonstrate commitment to the long-haul.
Aberdeen launched a portal, more than three years in the planning, populated it with 16 datasets and immediately let their open data officer leave at the end of a short-term contract. Some of their datasets are interesting and useful – but there was no consultation with the local data community about what they would find useful, or deliver benefits locally; all despite multiple invitations from me to interact with that community at the local data meet-ups which I was running in the city.
It was hoped that the programme under the Scottish Cities alliance would yield uniform datasets, prioritised across all seven Scottish Cities, but there is no sign of that happening, sadly. So what you find on all portals or platforms is pretty much a pot-luck draw.
Where common standards exist – such as the 360 Giving standard for the publication of support for charities – organisations should be universally adopting these. Yet this is only used by two of 32 authorities, all of whom have grant-making services. Surely, during a pandemic especially, it would be advantageous to funders and recipients to know who is funding which body to deliver what project?
Councils – Open Government Licence and RPSI
This is a slight aside from the publication of open data, but an important one. If the Scottish Authorities were to adopt an OGL approach to the publication of data and information on their website (as both the Scottish Government’s core site and the Information Commissioner for Scotland do) then we would be able to at least reuse data obtained from those sites. This is not a replacement for publishing proper open data but it would be a tiny step forward.
The table below (source and review data here) shows the current permissions to reuse the content of Scottish Local Authorities’ websites. Many are lacking in clarity, have messy wording, are vague or misunderstand terminologies. They also, in the main, ignore legislation on fair re-use.
Table of local authority adoption of PGL and RPSI
Open Government Licence
The Scottish Government’s own site is excellent and clear: permitting all content except logos to be be reused under the Open Government Licence. This is not true for local authorities. At present only Falkirk and Orkney Councils – two of the smaller ones – allow, and promote OGL re-use of content. There is no good reason why all of the public sector, including local government, should not be compelled to adopt the terms of OGL.
Re-use of Public Sector Information (RPSI) Regulations
Since 2015 the public sector has been obliged by the RPSI Regulations to permit reasonable reuse of information held by local authorities. So, even if Scottish LAs have not yet adopted OGL for all website content, they should have been making it clear for the last five years how a citizen can re-use their data and information from their website.
In my latest trawl through the T&Cs and Copyright Statements of 32 Scottish Local Authorities, I found only 7 referencing RPSI rights there, with 25 not doing so (see the full table above). I am fairly sure that these authorities are breaking the legal obligation on public bodies to provide that information.
Finally, given the presence of COSLA on the Open Government Scotland steering group, the situation with no open data; poor, missing or outdated data; and OGL and PRSI issues needs to be raised there and some reassurance sought that they will work with their member organisations to fix these issues.
The NHS Scotland Open Data platform continues to be developed as a very useful resource. The number of datasets there has more than doubled since last year (from 26 to 73).
None of the fourteen Health Boards publish their own open data beyond what is on the NHS Scotland portal.
Only one of the thirty Health and Social Care Partnerships (HSCPs) publish anything resembling open data: Angus HSCP.
COVID-19 and open data
While we are on health, I’ve wrote (here and here) early in the pandemic about the need for open data to help the better public understanding of the situation, and stimulate innovative responses to the crisis. The statistics team at Scottish Government responded well to this and we’ve started to develop a good relationship. I’ve not followed that up with a retrospective about what did happen. Perhaps I will in time.
It was clear that the need for open data in CV19 situation caught government and health sector napping. The response was slower than it should have been and patchy, and there are still gaps. People find it difficult to locate data when it is on muliple platforms, spread across Scots Govt, Health and NRS. That is, in a microcosm, one of the real challenges of OD in Scotland.
With an open Slack group for Open Data Scotland there is a direct channel that data providers could use to engage the open data community on their plans and proposals. They could also to sound out what data analysts and dataviz specialists would find useful. That opportunity was not taken during the Covid crisis, and while I was OK in the short term with being used as a human conduit to that group, it was neither efficient nor sustainable. My hope is that post SODU 2020, and as the next iteration of the Open Gov Scotland plan comes together we will see better, more frequent, direct engagement with the data community on the outside of Government, and a more porous border altogether.
There is no significant change across the sector in the past 18 months. The vast majority of institutions make no provision of open data. Some have vague plans, many of them historic – going back four years or more – and not acted on.
Lumping Universities and Colleges together, one might expect at a minimum properly structured and licensed open data from every institution on :
courses
modules
events
performance (perhaps some of this is on HESA and SFC sites?)
physical assets
environmental performance
KPI targets and achievements etc.
Of course, there is none of that.
Universities and colleges
I reviewed open data provision of Universities and Colleges around 17 February 2020. I revisited this on 11 August 2020, making minor changes to the numbers of data sets found.
While five of fifteen universities are publishing increasing amounts of data in relation to research projects, most of which are on a CC-0 or other open basis, there continues to be a very limited amount of real operational open data across the sector with loads of promises and statements of intent, some going back several years.
The Higher Education Statistics Agency publishes a range of potentially useful-looking Open Data under a CC-BY-4.0 licence. This is data about insitutions, course, students etc – and not data published by the institutions themselves. But I could identify none of that. Overall, this was very disappointing.
Further, while there are 20 FE colleges. None produces anything that might be classed as open data. A few have anything beyond vague statement of intent. Perhaps City of Glasgow College not only comes closest, but does link to some sources of info and data.
The Crighton Observatory
While doing all of this, I was reminded of the Crighton Institute’s Regional Observatory which was announced to loud fanfares in 2013 and appears to have quietly been shut down in 2017. Two of the team involved say in their Linked In profiles that they left at the end of the project. Even the domain name to which articles point is now up for grabs (Feb 2020).
It now appears (Aug 2020) that the total initial budget for the project was >£1.1m. Given that the purpose of the observatory was to amass a great deal of open data, I have also attempted to find out where the data is that it collected and where the knowledge and learning arising from the project has been published for posterity? I can’t locate it. This FOI request may help. The big question: what benefits did the £1.1m+ deliver?
In February 2019 I found that The Scottish Parliament had released 121 data sets. This covers motions, petitions, Bills, petitions and other procedural data, and is very interesting. This year we find that they have still 121 data sets, so, there are no new data sources.
In fact that number is misleading. In February 2020 I discovered that while 75 of these have been updated with new data, the remaining 46 (marked BETA) no longer work. As of August 2020 this is still the case. Why not fix them, or at worst clear them out to simplfy the finadbility of working data?
Some of these BETA datasets should contain potentially more interesting / useful data e.g. Register of Members Interests but just don’t work. Returning: [“{message: ‘Data is presently unavailable’}”]
I didn’t note the availability of APIs last year, but there are 186 API calls available. Many of these are year-specific. I tested half a dozen and about a third of those returned error messages. I suspect some of these align with the non-functioning historic BETAs.
Sadly the issues raised a year ago about the lack of clarity of the licensing of the data is unchanged. To find the licence, you have to go to Notes > Policy on Use of SPCB Copyright Material. Following the first link there (to a PDF) you see that you have to add “Contains information licenced under the Scottish Parliament Copyright Licence.” to anything you make with it, which is OK. But if you go to the second link “Scottish Parliament Copyright Licence” (another PDF) the wording (slightly) contradicts that obligation. It then has a chunk about OGL but says, “This Scottish Parliament Licence is aligned with OGLv3.0” whatever that means. Why not just license all of the data under OGL? I can’t see what they are trying to do.
Trying to work out the business units within the structure of Scottish Government is a significant challenge in itself. Attempting to then establish which have published open data, and what those data sets are, and how they are licensed, is almost an impossible task. If my checking, and arithmetic are right, then of 147 discrete business units, only 27 have published any open data and 120 have published none.
So we can say with some confidence that the issue with findability of data raised in Feb 2019 is unchanged, there being no central portal for open data in the Scottish public sector or even for Scottish Government. Searching the main Scottish Government website for open data yields 633 results, none of which are links to data on the first four screenfuls. I didn’t go deeper than that.
The Scottish Government’s Statistics Team have a very good portal with 295 Data Sets from multiple organisational-providers. This is up by 46 datasets on last year and includes a two new organisations: The Care Inspectorate and Registers of Scotland. The latter, so far (Aug 2020), has no datasets on the portal.
There are some interesting new entrants into the list of those parts of Scottish Government publishing data such as David MacBrayne Limited which is, I believe, wholly owned by SG and is the parent, or operator of Calmac Ferries Limited. On 1st March 2020 they released a new data platform to get data about their 29 ferry routes. This is very welcome. After choosing the dates, routes and traffic types you can download a CSV of results. While their intent appears to be to make it Open Data, the website is copyright and there is no specific licensing of the data. This is easily fixable.
It is also interesting to contrast Transport Scotland with work going on in England. Transport Scotland’s publication scheme says of open data “Open data made available by the authority as described by the Scottish Government’s Open Data Strategy and Resource Pack, available under an open licence. We comply with the guidance above when publishing data and other information to our website. Details of publications and statistics can be found in the body of this document or on the Publications section of our website.” I searched both without success for any OD. Why not say “we don’t publish any Open Data”? Compare this complete absence of open data with even the single project Open Bus Data for England. Read the story here. Scotland is yet again so far behind!
Summary
In the review of data I’ve shown that little has changed in 18 months. Very few branches of government are publishing open data at all. The landscape is littered with outdated and forgotten statements of good intent which are not acted on; broken links; portals that vanish or don’t work; out of date data; yawning gaps in publication and so on.
The claim of “Open By Default” in the current (2015) Open Data Strategy is misleading and mostly ignored with consequence. The First Minister may frequently repeat the mantra of “Open and Transparent” when speaking or questioned by journalists, but it is easily demonstrable that the administration frequently act in the directly opposite way to that.
The recent situations with Covid-19 and the SQA exams results show Scotland would have found itself in a much better place this year with a mature and well-developed approach to open data: an approach one might have reasonably expected after five full years of “open by default”.
The social and economic arguments for open data are indisputable. These have been accepted by most other governments of the developed world. Importantly, they have also been taken up and acted on by developing nations who have in many cases overtaken Scotland in their delivery of their Open Government plans.
The work I have done in 2019 and in this review is not a sustainable one – i.e. one single volunteer monitoring the activity of every branch and level of government in Scotland. And the methodology is limited to what is achievable by an individual.
A country which was serious about Open Data would have targets and measures, monitoring and open reporting of progress.
It wouldn’t just count datasets published. It would be looking at engagement, the usefulness of data and its integration into education.
It would fund innovation: specifically in the use of open data; in the creation of tools; in developing services to both support government in creating data pipelines, and in helping citizens in data use.
It would co-develop and mandate the use of data standards across the public sector.
It would develop and share canonical lists of ‘things’ with unique identifiers allowing data sets to be integrated.
It would adopt the concept of data as infrastructure on which new products, services, apps, and insights could be built.
I really want Scotland to make the most of the opportunities afforded by Open Data. I wouldn’t have spent ten years at this if I didn’t believe in the potential this offers; nor if I didn’t have the evidence to show that this can be done. I wouldn’t be giving up my time year-on-year researching this, giving talks, organising groups and creating opportunities for engagement.
What is fundamentally lacking here is some honesty from Scottish Government ministers instead of their pretence of support for open data.
Scotland is B, in the centre. Kenya is A, and Romania C.
I could have chosen Mexico, Honduras, Paraguay, Uruguay – or others. All are doing better than Scotland.


