In part one I described what we did at CTC18 to capture data and images of Commemorative Plaques in Aberdeen, and what I then did in the following three weeks.
A few people asked my why we would bother to put plaques into Wikidata and WikiCommons in this way. Why not have a council website – or why not use Open Plaques?
In this second instalment I am going to demonstrate how we can use the data which we have created to make some interesting visualisations and even do some calculations and analysis.
It can also power other new apps and services – allowing developers to create tailored routes around the city, on themes such as the arts or medicine – which is beyond the scope of this post.
Getting Started
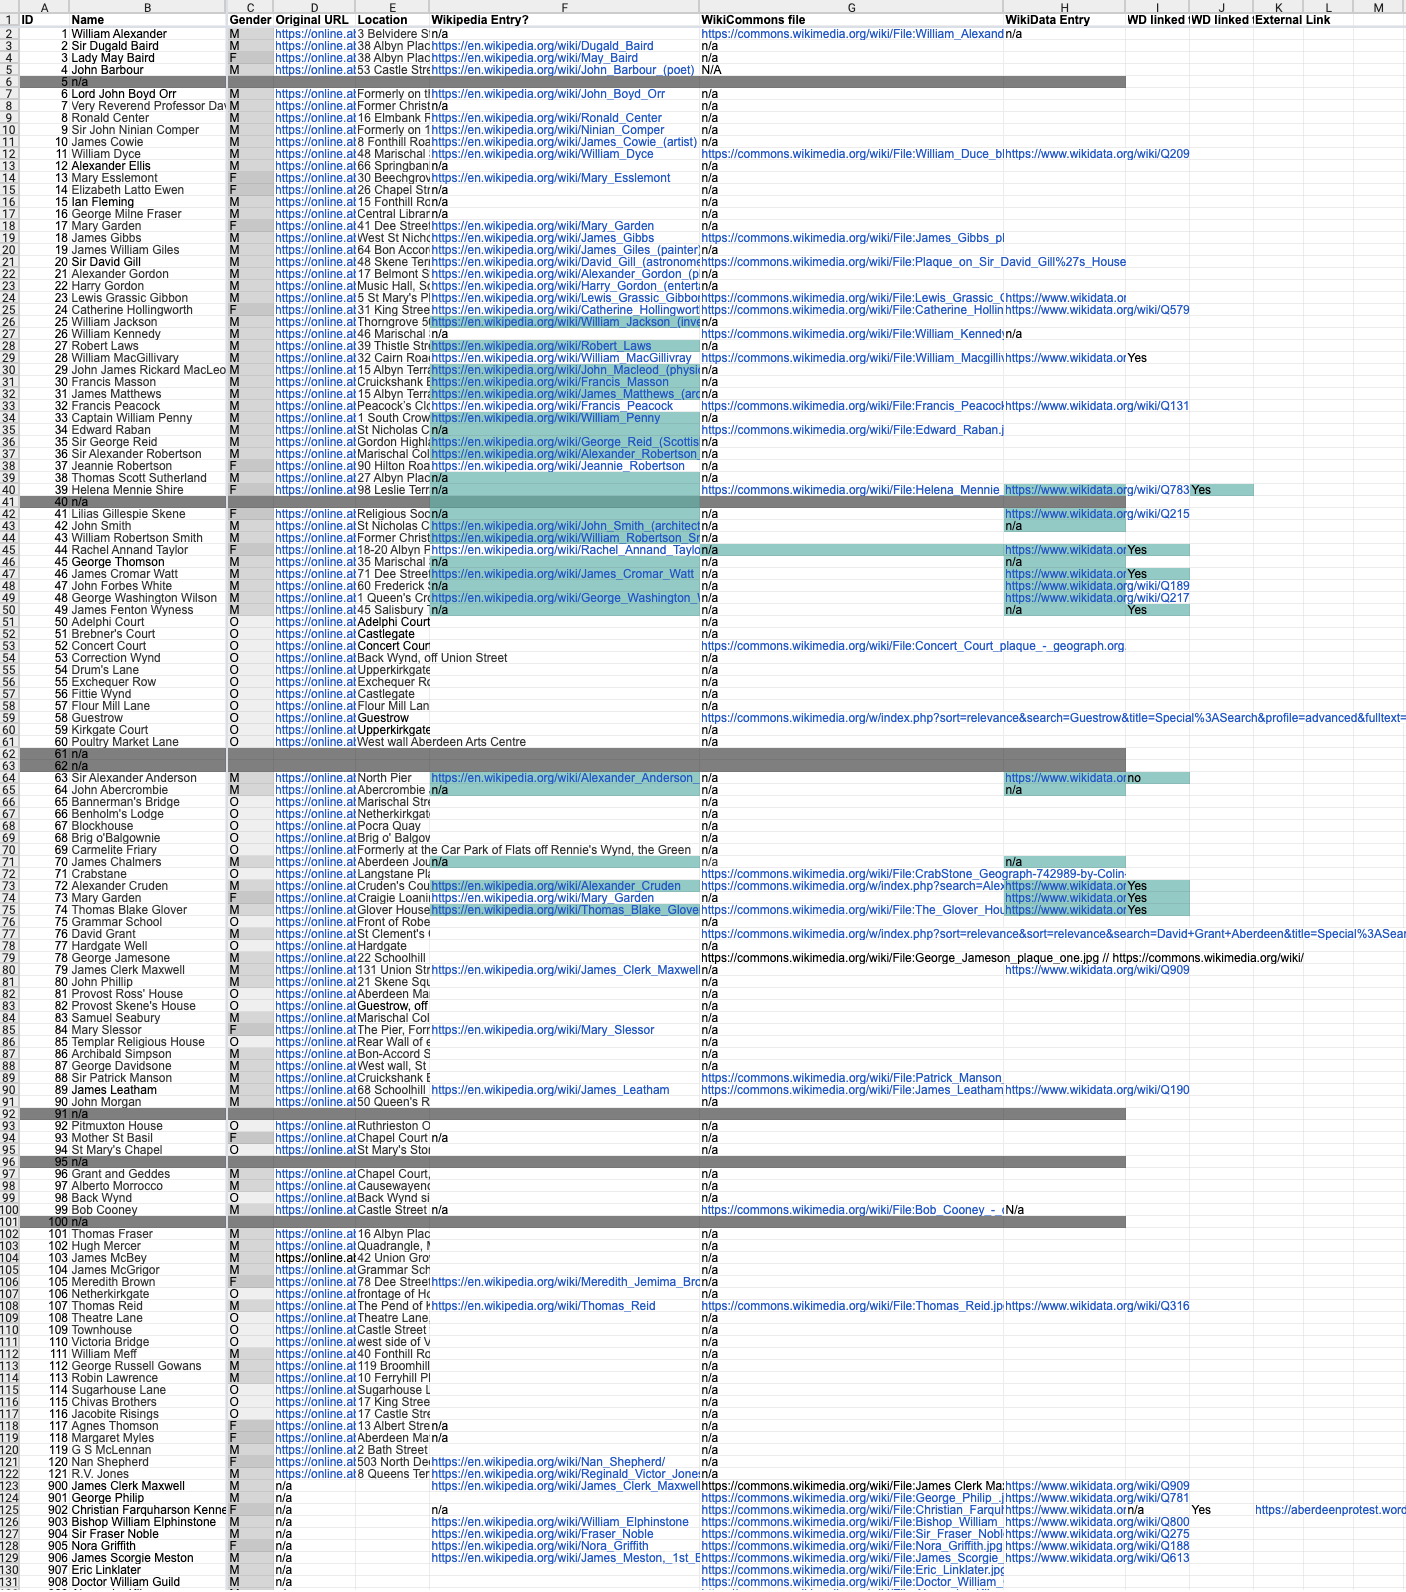
At the time of writing we now have 132 Aberdeen Commemorative Plaques recorded in Wiki Data.
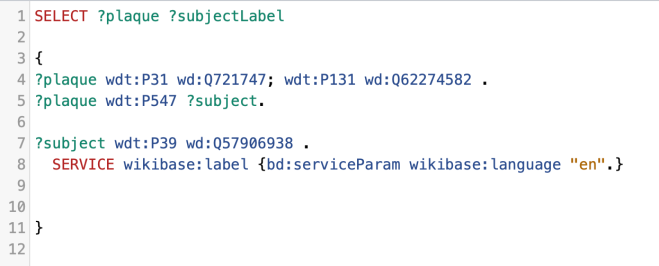
I can check that with this simple query on the Wiki Data Query Service:
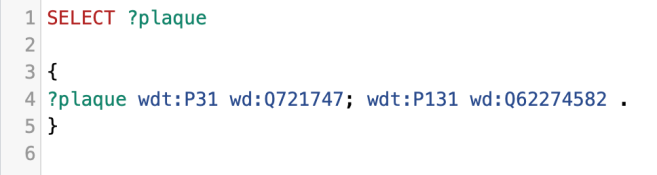
All that this does is ask for every instance (P31) of a commemorative plaque (Q721747) whcich is located in (P131) the Aberdeen City (Q62274582) area.
Try It for yourself.
Click on the white-on-blue arrow at the left. See what it produces. Note the bottom half of the screen turns into a table of results, and on the centre bar there is a message ‘xxx results in xxxx milliseconds‘.
How many pictures of plaques?
I can retrieve the photograph for plaque using the following query.
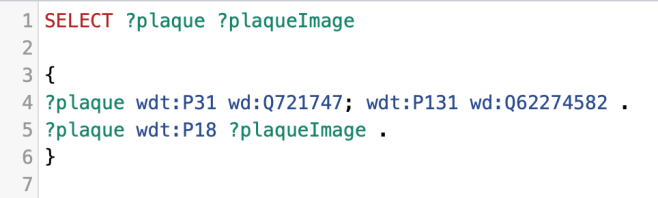
Here I am saying give us plaques which have image (P18). In effect this is saying ONLY those that have an image. If not all entries have an image, yet, then we will get a smaller number.
As I run it I get 126 – which is six fewer than I got plaques.
Get all plaques with images or not
Let’s modify the query to this.
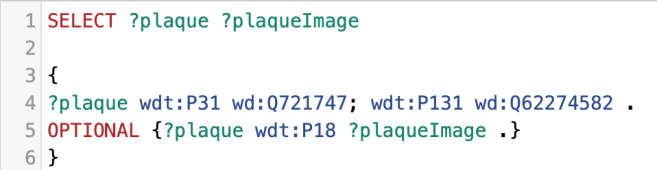
Here I am the OPTIONAL command which has the effect of saying IF there is an image give me it, but don’t restrict the results to only those with images. When we run that we can spot the missing ones by scrolling down through the list. I get six plaques with no images. This is a useful technique to spot missing things when totals (in this case plaques and images) don’t tally.
Commemorating who or what?
As it stands the query is still not very user-friendly as all we have for the plaques is their Plaque ID. Of course we can click on those, but it would be more helpful to have the names of their subjects.
We’ll do that in two steps.
Firstly, let’s work out what the subjects are.
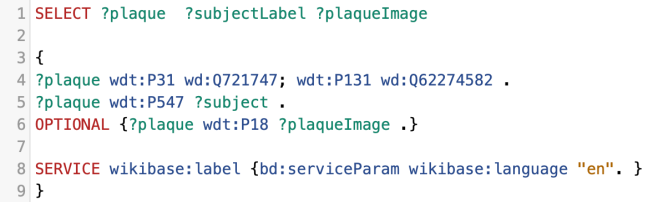
We can add the following line to the query and remember to add ?subject to the SELECT on the first line.
?plaque wdt:P547 ?subject
Note P547 is the statement “commemorates“.
If we run that we get a new column called subject and it is filled with links to subject IDs, which are the Wikidata entries for either people or things that the plaques commemorates. I note that when I run it my list has grown from 132 to 134.
Any guesses why that should be?
Some of the plaques commemorate more than one person.
Let’s make it a bit more friendly.
Add the following line just before the end of your query
SERVICE wikibase:label {bd:serviceParam wikibase:language "en". }
And change ?subject to ?subjectLabel in the first line.
This instructs the WikiData Query service to use another service to retrieve labels from the items.
The label is in effect the title of the Wikidata item. Look at this one https://www.wikidata.org/wiki/Q80818579 Immediately below the title, and to the left, there is an edit link. Click that. See how the ‘label‘ and the ‘description‘ immediately below it become editable. Cancel that for now.
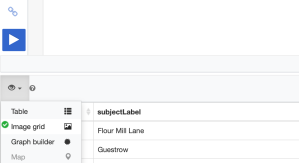
Try running that query to get subject names (labels) back
Now we have a name (in a subjectLabel column) for who or what is being commemorated.
Which provosts have plaques?
We can ask which of our plaques commemorates a previous Lord Provost of Aberdeen.
We use the P547 (commemorates) statement to get our subject, then use the following
subject wdt:P39 wd:Q57906938.
where P39 is Position Held, and Q57906938 is the identifier for Lord Provost of Aberdeen.
Currently we appear to have four plaques to former Lord Provosts.
Note: the “Try it” link below has been updated to take account of subsequent work done to separate Provosts and Lord Provosts into separate categories.
A different view
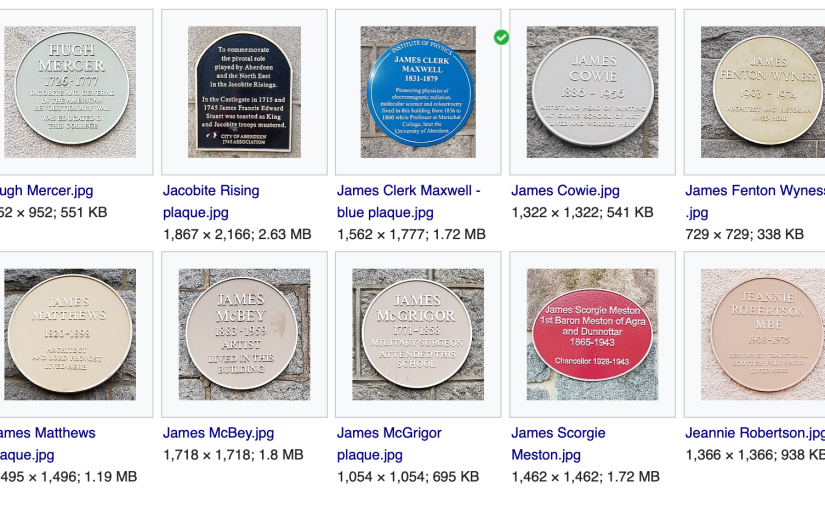
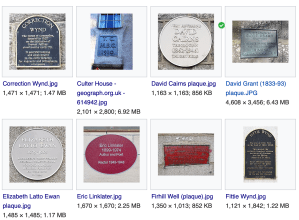
At this point you might want to change the view for your query just to have a look at the images we have.
Above the table of results, on the extreme left there is an eye symbol and a drop down. Choose “Image Grid” to see the images only.
You might also have noticed that there are other options, several of which are greyed out as we don’t yet have that data in our query. These views include ‘Map‘ and “Timeline‘. We’ll come back to those.
Our Image Grid looks something like this:
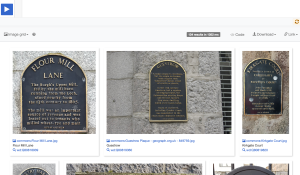
Remember to swap back to ‘Table’ view once you’ve finished.
Adding more data fields
We can now add more data fields to our query.
Firstly, let’s add the geographic coordinates of the plaques’ locations.
Add the following line to your code:
OPTIONAL {?plaque wdt:P625 ?coordinates .}
and, again add the new value, ?coordinates to the first line of the query too.
You will now have an extra field in the returned data table.
Mapping results
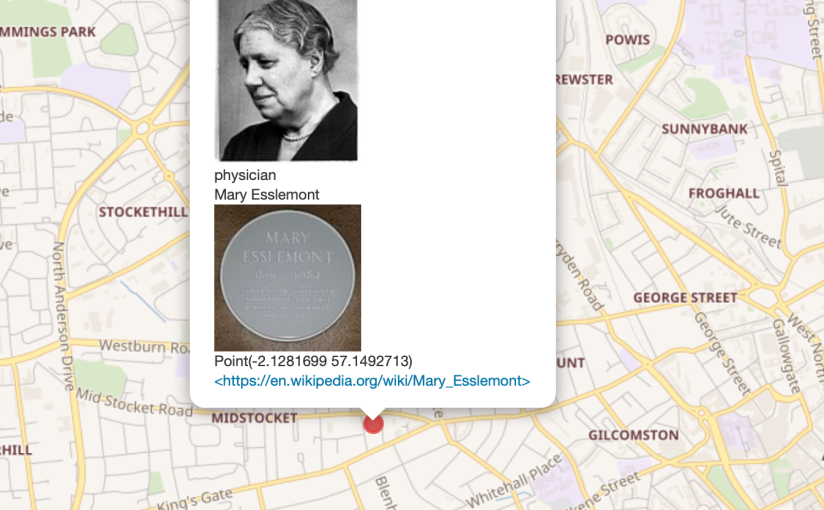
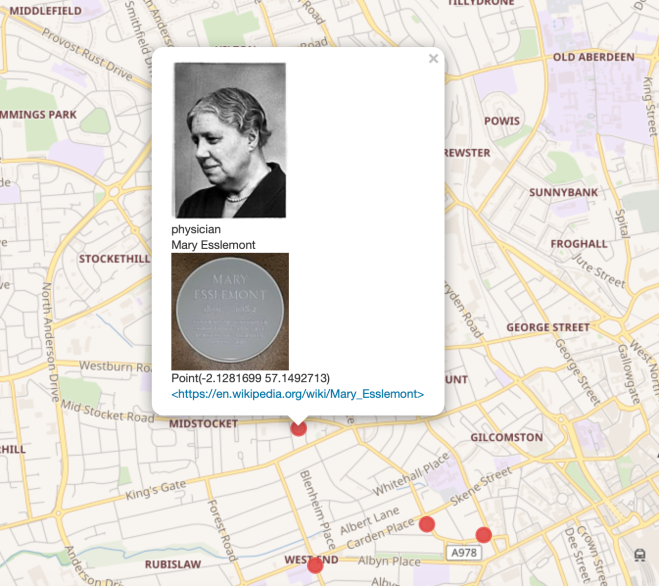
Now change the view from Table to Map. The Wikidata query service automatically uses the coordinates to plot the results on a map which is scaled to show the results. You may need to scroll down to see all of the map. Click on one of the plotted points. You should get a pop up with the name of the person or building commemorated, plus a photo of the plaque itself, as shown below.

Note – if you add the following as the first line of your query, it will default to a map view rather than table when first run.
#defaultView:Map
Now let’s see if we can get more data for the people for whom there are plaques.
Dates of birth and death
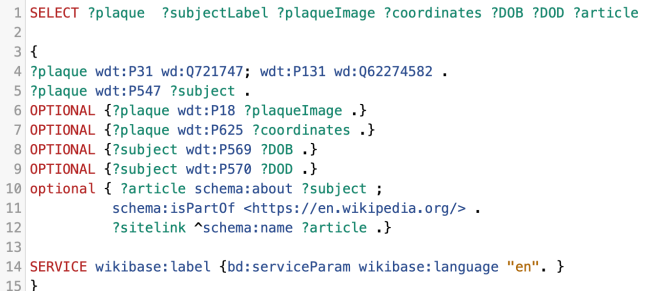
We can change our query to find out if there are dates of birth and death for our human subjects (rather than buildings).
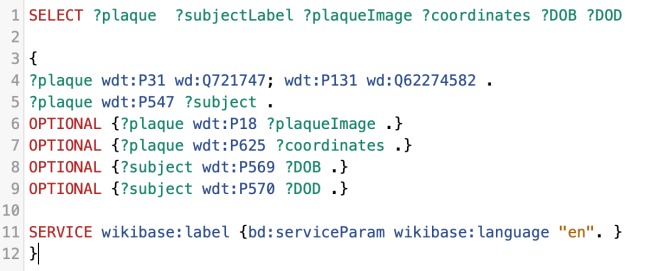
We can use P569 (date of birth) and P570 (date of death) and ascribe those to
?DOB and ?DOD respectively – again, adding those fields to our SELECT statement on line one. Your query should look like this?
Looking at our table of results we can see that we have a mix of types of results – people, bridges, buildings etc. but only the people have dates.
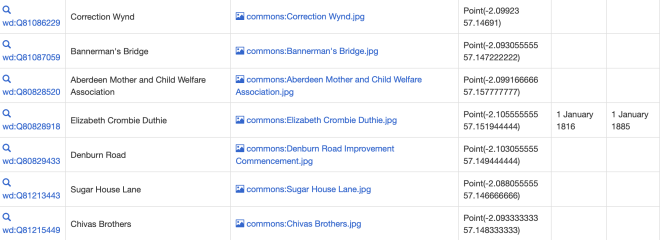
Interestingly the one subject with the DOB and DOD in the screenshot above is Elizabeth Crombie Duthie who gifted Duthie Park to the city of Aberdeen.
Remember, if you change the DOB and DOB from being OPTIONAL to just being regular requests, you can filter records to show ONLY those with dates associated with them which will screen out not only non-human subjects but will exclude any people with incomplete or missing dates.
Notable people
It could be argued that the fact there is a plaque to a person would indicate that they are notable, but not every person or object for which there is a plaque has a Wikipedia article. Let’s add some code to see which of our plaques has an associated article.
Changing the above so that we remove the OPTIONAL {} around the section beginning ?article we get ONLY those with Wikipedia articles which is, as I run it, 79 plaque subjects.
You can if you want we add the following
?subject wdt:P31 wd:Q5 .
where P31 (instance of ) is Q5 (human) we can screen out all of the non-people plaques.
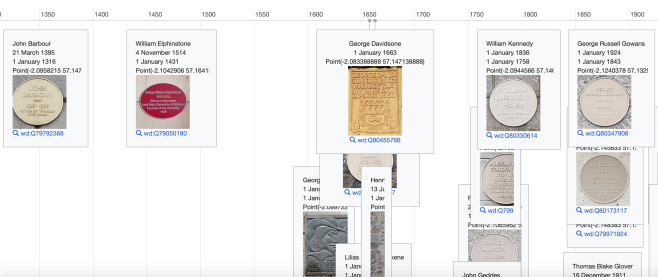
At this point, try flipping the view to TimeLine – you may have to scroll down quite a way to see all of the plaques. Many of them are concentrated at the right, spanning much of the 20th century. You should see John Barbour (1316-1395 at the extreme left).
Finally, before we start doing some statistical analysis let’s try something more sophisticated.
Can we create a map showing only female subjects whose work was in the medical sciences?
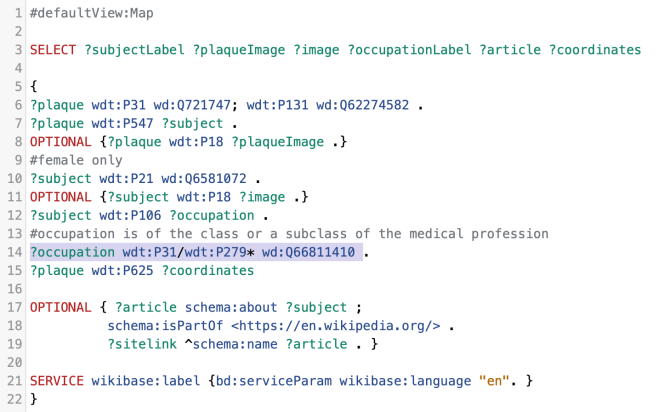
To do that we need to select only subjects who have a P21 (gender or sex) of Q6581072 (female). Then we need to select an occupation (P31) which is an instance or subclass of Q66811410 (the medical profession). This requires a structure that we haven’t see before:
?occupation wdt:P31/wdt:P279* wd:Q66811410
While we are at it, let’s get an image of the subject if there is one, and find out of there is a wikipedia article about the subject. And, since we want a map, we add that as our default view at the top.
This gives us the following output:
Changing this query to male (Q6581097) or choosing different types of professions is straightforward.
Statistical analysis
The Wikidata Query Service allows us to move beyond visualising the data in different ways. Let’s have a look at a couple of examples.
Analysing who or what is commemorated
The following query finds out what the subject of the plaque is an instance of (P31) – line 6:
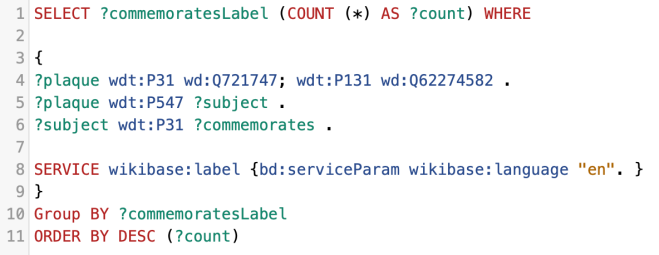
but instead of creating a list, it use the COUNT () function to analyse the subject being an instance of (P31) Instance Of.
We can see that we have 105 humans, 5 lanes etc. Note that some double counting occurs. Some structures, for example, are instances of two things.
We can also analyse the gender of the human subjects just by changing P31 in the above to P21 (Sex or Gender).
At present I get
That’s far from gender equality, isn’t it!
What’s in a name?
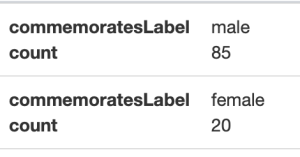
Ascertaining the most common first names on plaques is also straightforward.
We use P735 (given name) statement, get the labels, count and group by those.
We get the following results
With 81% of plaques to people being for males it is hardly surprising that our league table of names begins with James, William, George, John, Alexander ….
We can do more sophisticated analysis too.
Analysing Occupations
We can add the following line to our query to get back the occupation of the subject of the plaque:
?subject wdt:P106 ?occupation
Bear in mind that many of our plaque subjects are true polymaths. Have a look at Robert Brown. He has 10 listed occupations!
So what are the most common occupations of those people for whom there are plaques? Any guesses?
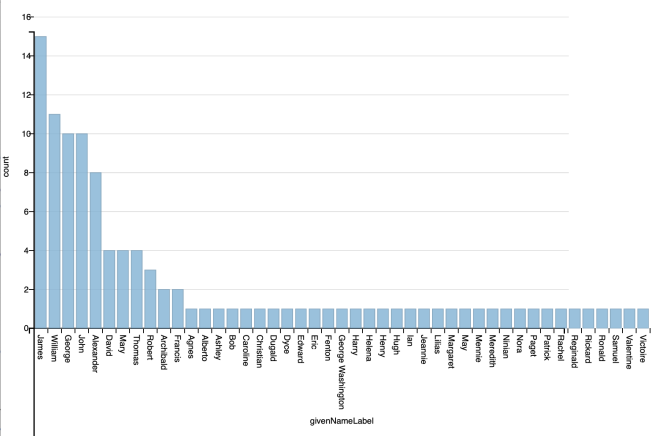
Let’s use the following query:
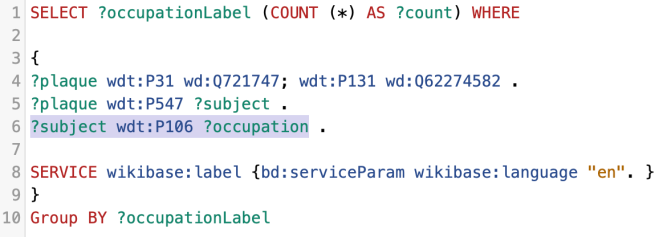
This uses the COUNT () function as well as a GROUP BY clause. The query looks at all of the different occupation labels, counts how many of each there are.
This returns, by default, a table of values. We can flip to a Bar Chart to make better sense of the data:
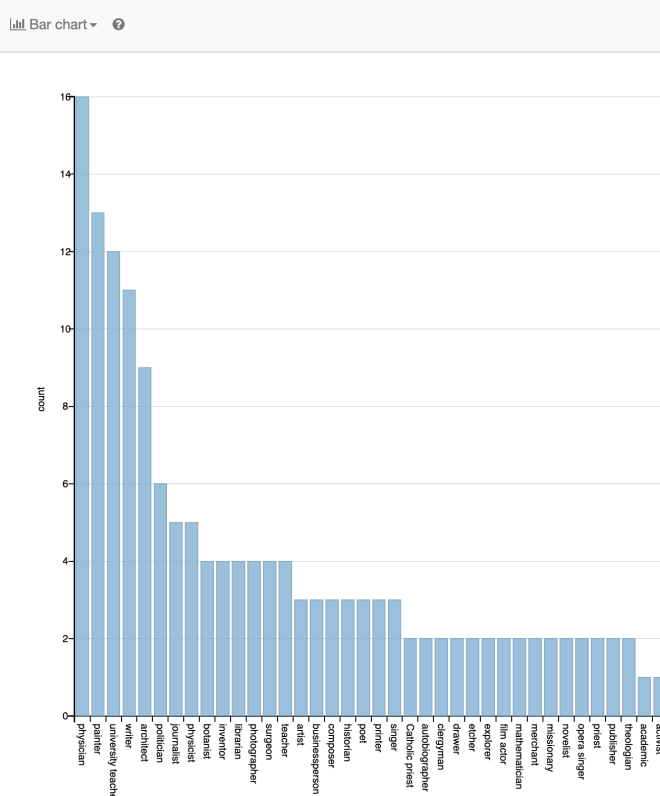
So, we can see that for those commemorated by a plaque the most common occupations are Physician, Painter, University Lecturer, Writer and so on.
We can add a couple of refinements if we wish. If we want our query to default to a BarChart when we run it we can add the following line at the start of the query:
#defaultView:BarChart
and if we want the table to be sorted by value we can add a line such as
ORDER BY DESC (?count)
What next?
Over the last month I’ve been busy gathering data, taking photographs and publishing all of those on WikiData and wiki Commons. That phase is not quite complete, if it ever could be considered complete. You can monitor live progress here.
There are a couple of photographs which I can’t easily take which I know Aberdeen City Council’s Museum and Galleries team have. It would be great to see those made available by them on Wiki Commons, as I have shared the 148 plaque photos I have taken.
I know of at least 24 more plaques which I have photographed which are not listed yet in Wikidata.
When I published part one of this series I got some great feedback on Twitter. One suggestion is that we add structured data to the Wiki Commons pages for each photograph. Another was to add further data to the record for each plaque using statement P276 (location) where the plaque is on a known listed building. So far I have done that for 5 plaques – check it for yourself. There are loads more to do.
Many of the people records that I have created in Wikidata are skeletal. They need more detail, photographs, biographical links etc. Similarly, given that people or places are noteworthy enough to merit a plaque, they should pass the notability test for Wikipedia, yet at least 68 plaque subjects have no Wikipedia entry.
And plaques are just a start – an easy introduction to what is possible given, in this case, about 100 hours of work. While that was almost all done by one person, if we ran a Code The City weekend on a similar theme and similar sized challenge, six people could achieve the same over a weekend with a little coordination.
At Code The City, we’re about to start discussions with the local cultural institutions about setting up a more formal alliance for the city (shire?) to help shape how they use digital and data more effectively and grow volunteers with skills and tools to make that happen, which is an exciting note on which to finish this post! Watch this space, as they say.
Ian