Mapping Memorials to Women in Aberdeen

This project, which was part of CTC20,  grew from a WMUK / Archaeology Scotland join project carried out by Scottish Graduate School of Arts & Humanities intern Roberta Leotta during lockdown 2020. More details about the background to the project can be found here.

It’s often touted that there are some cities in Scotland (coughEdinburghcough) where there are more statues to animals than there are to women. In my own work transferring OpenPlaques data to Wikidata I’ve observed that there are more entries for Charles Rennie Macintosh than there for women in Glasgow. So in this light, it’s somewhat refreshing to work on a project that celebrates all kinds of memorials to women in Scotland.

The Women of Scotland: Mapping Memorials project began in 2010 as a joint project between Glasgow Women’s Library, and Women’s History Scotland. It’s similar in many ways to OpenPlaques, but using Wikidata could add an extra dimension – let’s increase the coverage of women’s history and culture on the Wikimedia projects by getting these memorials and the women they celebrate into Wikidata, use that to identify gaps in knowledge, and then work to fill the gap.

Over the two days, here’s what we did:

Data collection

We scraped the initial list of data from Mapping Memorials website manually, and created a shared worksheet based on a model that’s been used previously for other cities. (The manual process is slow, and a bit fiddly, and is the one thing that I wouldn’t do again. We’re in contact with the admin so going forward, I’m hopeful that we wouldn’t need to repeat this step in the future.)

Once we had this list, we could create a more automated process to deal with gathering the other pieces of information we needed to create new, good quality Wikidata items, although some (description, for example) needed a human eye.

Wikidata identifiers

We were using two main identifiers on Wikidata – P8048 (Women of Scotland memorial ID) and P8050 (Women of Scotland subject ID). The former for the entries to the memorials themselves, and the latter for the women they celebrate. Where the women didn’t have entries, we could create those, and then link them to the entries for the memorials.

Both identifiers use the last part of the URL for each entry on the Mapping Memorials site, so that was fairly easy to do in Google docs. Once we had that info, it’s an easy enough step to bulk-create items either using Quickstatements or Wikibase CLI.

Creating items & avoiding duplicates

There’s a plug in for Google Sheets called Wikipedia and Wikidata Tools which has some useful features for projects like this – WikidataQID for looking up whether something already exists on Wikidata, and WikidataFacts, which tells you what that item is. The former is ok if you have an exact match, the latter is really useful for flagging anything which might lead to a disambiguation page, for example.

Ultimately we did end up with a few duplicates that needed to be merged, but this was pretty easily managed, and it really showed how useful it is to have local knowledge involved in local projects – there were a couple of sets of coordinates that were obviously wrong, but also some errors that wouldn’t have been spotted by someone unfamiliar with the area.

Coordinates and dates

I really like Quickstatements, but there are a few areas in which it’s fiddly, including coordinates and dates. I’m really interested in looking further into Wikibase CLI for dates in particular, as the process there for dates (documented here) looks to be substantially easier in terms of data prep than it does in Quickstatements. Many thanks to Tony for that work, as his expertise saved us a lot of time! He also used that tool to create items for those women commemorated who were missing from Wikidata, documented here.

As with dates, coordinates are entered into Quickstatements in a different format than that which you’d use manually inside Wikidata itself, hence the formatting you’ll see in column Q on the Data collection tab. Most of this we had to grab from Google Maps, which again is a bit fiddly.

Quickstatements

Once we had a master list of QIDs for the memorials we were working with, we could use Quickstatements to bulk upload sets of statements to those items.

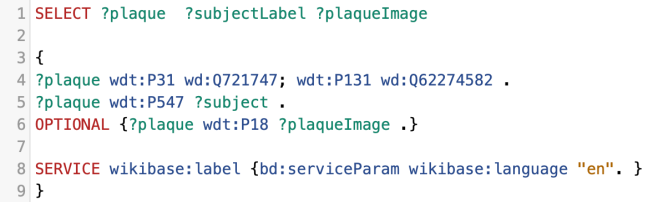
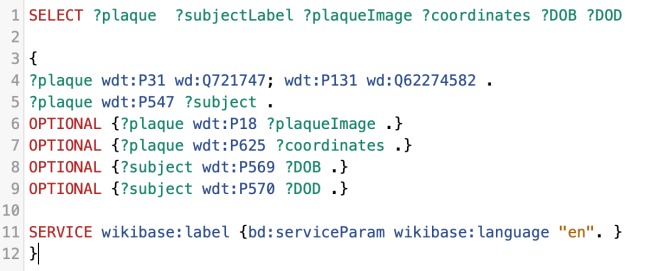
For example, matching the memorials to the women commemorated, using this format:

Screenshot of a spreadsheet showing QID for memorials and the women they commemorate

The Q numbers on the left are those of the memorials, P547 is “commemorates”, and the Q numbers on the right are those of the women celebrated. We were also able to add P8050 (Women of Scotland subject ID) to some women who already had entries on Wikidata, but no WoS ID.

Screenshot of a spreadsheet showing each memorial QID and its type

The Q number on the left again is the memorial, P31 is “instance of”, and the Q number on the right corresponds to a type of thing – a commemorative plaque, a garden, or a road, for example.

Once you’ve got the info in this format, it’s just a case of copy & pasting into QS, clicking import, and then run. (Note – you do need to be an autoconfirmed user to use QS, which means that your account must be at least 4 days old, and having more than 50 edits.) It’s relatively easy, and I was pleased that one of our relatively-new-to-Wikidata participants had the chance to make her first bulk uploads (description & commons category) using the tool over the weekend.
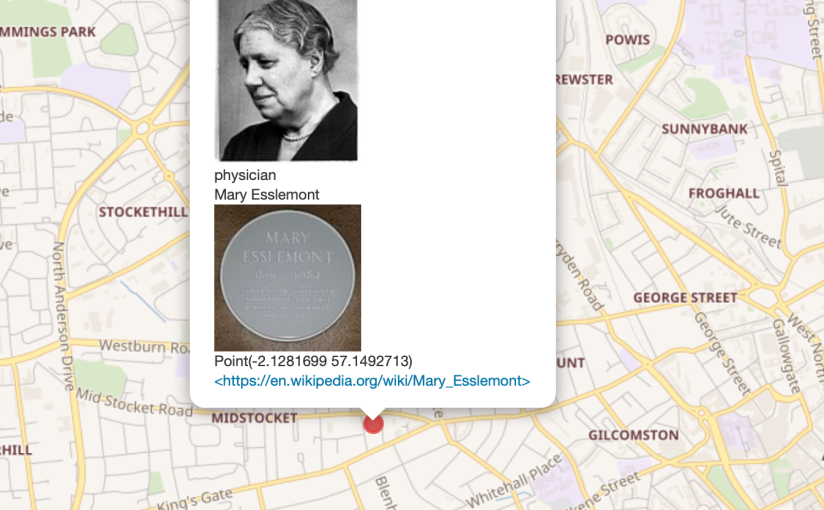
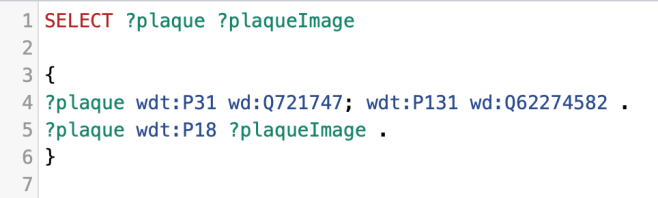
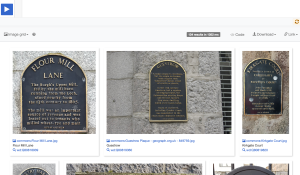
Photos

This project grew out of a desire to increase the coverage of Scottish heritage on Wikimedia Commons, so it was great to take some time on this. Mapping Memorials does have some images, but they’re not openly licensed, and others are missing. After Wikimedia Commons, our next port of call was Geograph, where many images have been released on Wiki-compatible Creative Commons licenses. Using Geograph2Commons, images can easily be transferred over to Wikimedia Commons, so that they can be used in any Wikimedia Project. Geograph also links to this feature from their site – click on “Find out how to reuse this image”, and then scroll down to “Wikipedia template for image page”, then click on the “geograph2commons” link. Really simple. Our group did some detective work for images, and then added them to Commons, and linked them manually to the Wikidata item.

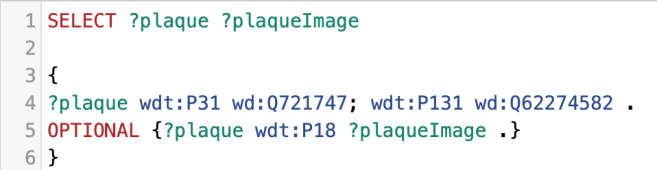
This gave us a list of missing images… which is fine, but wouldn’t it be better to see them on a map?

Visualisation and filling the gaps

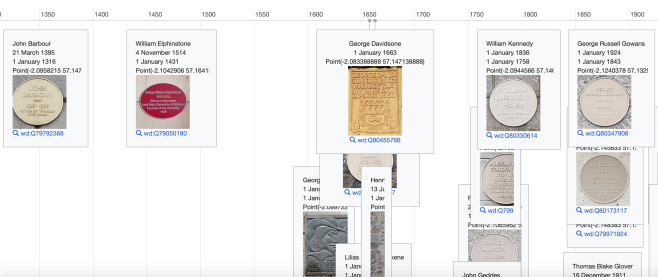
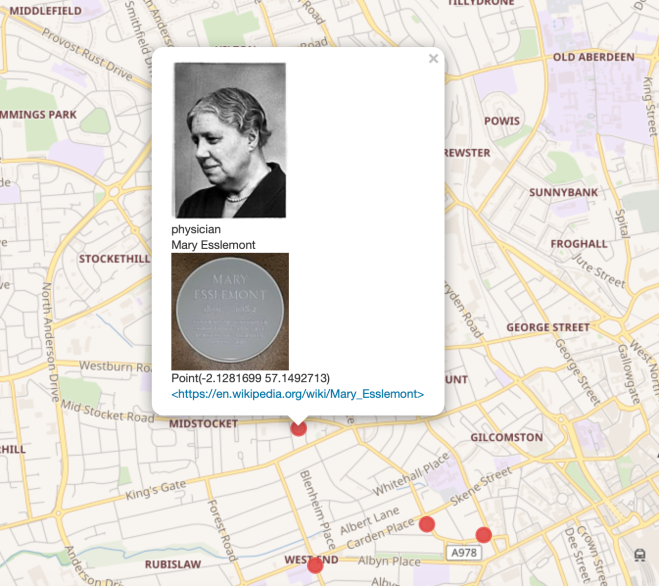
Thanks to Ian’s tutorial on how to create a custom WikiShootMe map, we were able to create a custom map that showed us which of the memorials we were working on had images, which didn’t, and where they were. That map is here, and it was great to see it slowly turn more green than red over the weekend as we found more images, or as volunteers headed out across Aberdeen between days to take missing pictures.

A screenshot of a clickable map where people can upload photos of monuments

One of the small, but very satisfying, things you can do with these kinds of images is to integrate them into relevant Wikipedia articles. I added images from the project to the articles for Aberdeen Town House, Caroline Phillips, and Katherine Grainger. At the time of writing, around 2500 people have viewed those articles since I added the images.

Next steps

Over the course of the weekend we added 77 new memorials, and 26 new women to Wikidata, as well as a whole host of new photos. These entries all had some quite rich data, and as complete as we could make it.

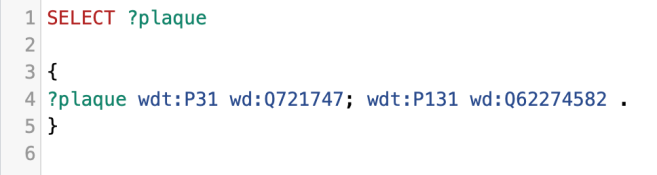
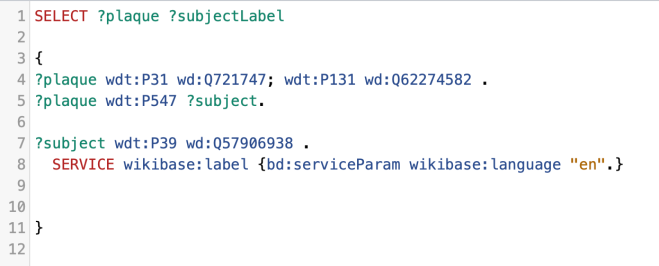
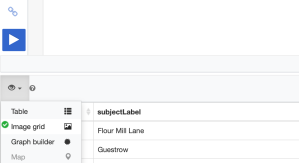
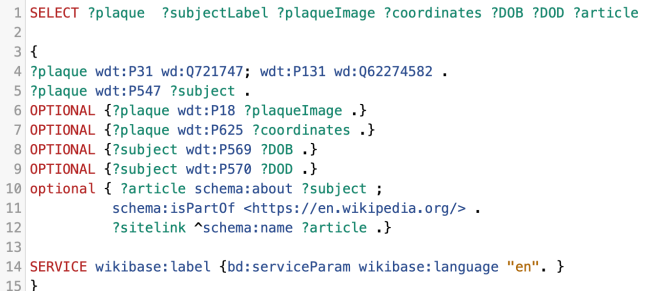
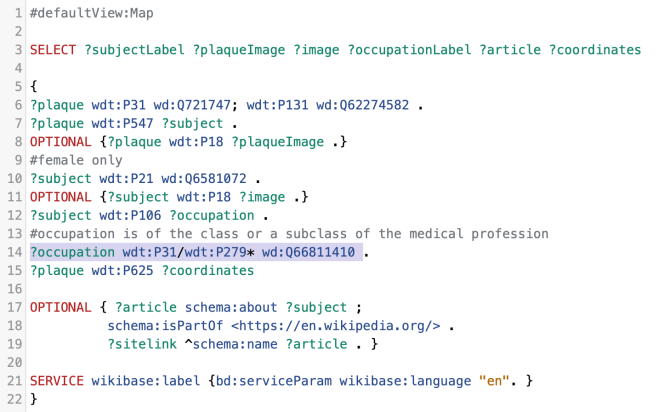
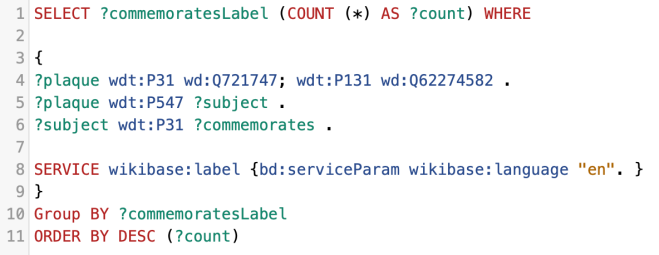
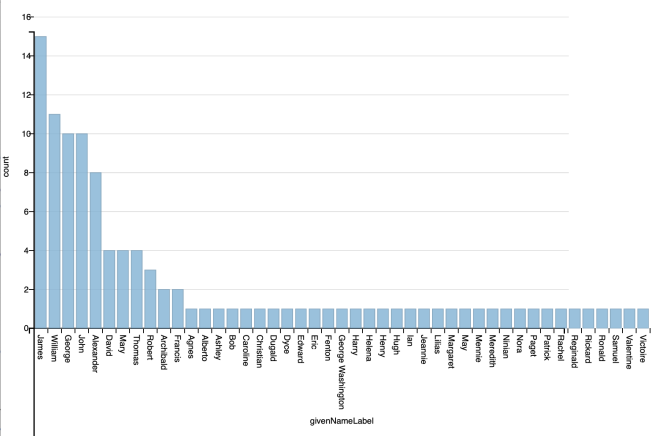
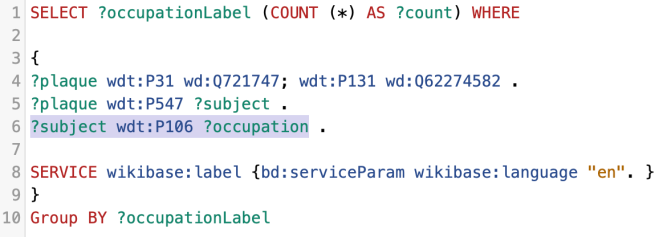
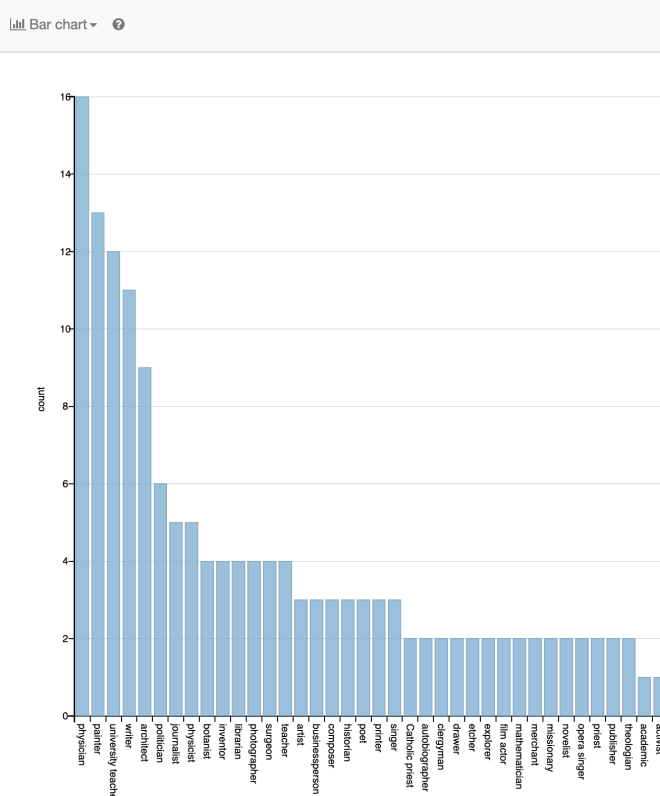
We were surprised to see some of the individuals who didn’t have a Wikipedia article – and of course, we can use the Wikidata query service to identify those gaps. The queries below could give us a great starting point for an editathon, or indeed, for any Wikipedia editor interested in writing Women’s biography.

  • Wikidata query for women with a Women of Scotland subject ID, a memorial in Aberdeen, but no enwiki article: https://w.wiki/YVH
  • Wikidata query for women with a Women of Scotland subject ID, but no enwiki article: https://w.wiki/YVG

Huge thanks to the team, and to Code the City for another great hack weekend!

Dr Sara Thomas
Scotland Programme Coordinator, Wikimedia UK

——————————————————————————

Header image: The Grave of Jessie Seymour Irvine by Ian Watt on Wiki Commons  (CC-BY-SA)

Aberdeen Plaques – Part Two

In part one I described what we did at CTC18 to capture data and images of Commemorative Plaques in Aberdeen, and what I then did in the following three weeks.

A few people asked my why we would bother to put plaques into Wikidata and WikiCommons in this way. Why not have a council website – or why not use Open Plaques?

In this second instalment I am going to demonstrate how we can use the data which we have created to make some interesting visualisations and even do some calculations and analysis.

It can also power other new apps and services – allowing developers to create tailored routes around the city, on themes such as the arts or medicine – which is beyond the scope of this post.

Getting Started

At the time of writing we now have 132 Aberdeen Commemorative Plaques recorded  in Wiki Data.

I can check that with this simple query on the Wiki Data Query Service:

Plaques - Query One
Plaques – Query One

All that this does is ask for every instance (P31) of a commemorative plaque (Q721747) whcich is located in (P131) the Aberdeen City (Q62274582) area.

Try It for yourself.

Click on the white-on-blue arrow at the left. See what it produces. Note the bottom half of the screen turns into a table of results, and on the centre bar there is a message ‘xxx results in xxxx milliseconds‘.

How many pictures of plaques?

I can retrieve the photograph for plaque using the following query.

Plaques - Query Two
Plaques – Query Two

Here I am saying give us plaques which have image (P18). In effect this is saying ONLY those that have an image. If not all entries have an image, yet, then we will get a smaller number.

Try it.

As I run it I get 126 – which is six fewer than I got plaques.

Get all plaques with images or not

Let’s modify the query to this.

Plaques - Query Three
Plaques – Query Three

Here I am the OPTIONAL command which has the effect of saying IF there is an image give me it, but don’t restrict the results to only those with images. When we run that we can spot the missing ones by scrolling down through the list. I get six plaques with no images. This is a useful technique to spot missing things when totals (in this case plaques and images) don’t tally.

Try it.

Commemorating who or what?

As it stands the query is still not very user-friendly as all we have for the plaques is their Plaque ID. Of course we can click on those, but it would be more helpful to have the names of their subjects.

We’ll do that in two steps.

Firstly, let’s work out what the subjects are.

We can add the following line to the query and remember to add ?subject to the SELECT on the first line.

 ?plaque wdt:P547 ?subject

Note P547 is the statement “commemorates“.

Try it

If we run that we get a new column called subject and it is filled with links to subject IDs, which are the Wikidata entries for either people or things that the plaques commemorates. I note that when I run it my list has grown from 132 to 134.

Any guesses why that should be?

Some of the plaques commemorate more than one person.

Let’s make it a bit more friendly.

Add the following line just before the end of your query

 SERVICE wikibase:label {bd:serviceParam wikibase:language "en". }

And change ?subject to ?subjectLabel in the first line.

This instructs the WikiData Query service to use another service to retrieve labels from the items.

Plaques - Query Four
Plaques – Query Four

The label is in effect the title of the Wikidata item. Look at this one https://www.wikidata.org/wiki/Q80818579 Immediately below the title, and to the left, there is an edit link. Click that. See how the ‘label‘ and the ‘description immediately below it become editable. Cancel that for now.

Try running that query to get subject names (labels) back

Now we have a name (in a subjectLabel column) for who or what is being commemorated.

Which provosts have plaques?

We can ask which of our plaques commemorates a previous Lord Provost of Aberdeen.

We use the P547 (commemorates) statement to get our subject, then use the following

subject wdt:P39 wd:Q57906938.

where P39 is Position Held, and Q57906938 is the identifier for Lord Provost of Aberdeen.

Plaques - provosts?
Plaques – provosts?

Currently we appear to have four plaques to former Lord Provosts.

Note: the “Try it” link below has been updated to take  account of subsequent work done to separate Provosts and Lord Provosts into separate categories.

Try it

A different view

At this point you might want to change the view for your query just to have a look at the images we have.

Above the table of results, on the extreme left there is an eye symbol and a drop down. Choose “Image Grid” to see the images only.

Plaques - change view
Plaques – change view

You might also have noticed that there are other options, several of which are greyed out as we don’t yet have that data in our query. These views include ‘Map‘ and “Timeline‘. We’ll come back to those.

Our Image Grid looks something like this:

Plaques - Image Grid
Plaques – Image Grid

Remember to swap back to ‘Table’ view once you’ve finished.

Adding more data fields

We can now add more data fields to our query.

Firstly, let’s add the geographic coordinates of the plaques’ locations.

Add the following line to your code:

 OPTIONAL {?plaque wdt:P625 ?coordinates .}

and, again add the new value, ?coordinates to the first line of the query too.

You will now have an extra field in the returned data table.

Try it 

Mapping results

Now change the view from Table to Map. The Wikidata query service automatically uses the coordinates to plot the results on a map which is scaled to show the results. You may need to scroll down to see all of the map. Click on one of the plotted points. You should get a pop up with the name of the person or building commemorated, plus a photo of the plaque itself, as shown below.

Plaques - map view
Plaques – map view

Note – if you add the following as the first line of your query, it will default to a map view rather than table when first run.

#defaultView:Map

Now let’s see if we can get more data for the people for whom there are plaques.

Dates of birth and death

We can change our query to find out if there are dates of birth and death for our human subjects  (rather than buildings).

We can use P569 (date of birth) and P570 (date of death) and ascribe those to
?DOB and ?DOD respectively – again, adding those fields to our SELECT statement on line one. Your query should look like this?

Plaques - Query Five
Plaques – Query Five

Try it

Looking at our table of results we can see that we have a mix of types of results – people, bridges, buildings etc. but only the people have dates.

Table showing dates of birth

Interestingly the one subject with the DOB and DOD in the screenshot above is Elizabeth Crombie Duthie who gifted Duthie Park to the city of Aberdeen.

Remember, if you change the DOB and DOB from being OPTIONAL to just being regular requests, you can filter records to show ONLY those with dates associated with them which will screen out not only non-human subjects but will exclude any people with incomplete or missing dates.

Notable people

It could be argued that the fact there is a plaque to a person would indicate that they are notable, but not every person or object for which there is a plaque has a Wikipedia article. Let’s add some code to see which of our plaques has an associated article.

Plaques - Query Six
Plaques – Query Six

Try It

Changing the above so that we remove the OPTIONAL {} around the section beginning ?article  we get ONLY those with Wikipedia articles which is, as I run it, 79 plaque subjects.

You can if you want we add the following

 ?subject wdt:P31 wd:Q5 .

where P31 (instance of ) is Q5 (human) we can screen out all of the non-people plaques.

Try it

At this point, try flipping the view to TimeLine – you may have to scroll down quite a way to see all of the plaques. Many of them are concentrated at the right, spanning much of the 20th century. You should see John Barbour (1316-1395 at the extreme left).

Plaques - timeline
Plaques – timeline

Finally, before we start doing some statistical analysis let’s try something more sophisticated.

Can we create a map showing only female subjects whose work was in the medical sciences?

To do that we need to select only subjects who have a P21 (gender or sex) of Q6581072 (female). Then we need to select an occupation (P31) which is an instance or subclass of Q66811410 (the medical profession). This requires a structure that we haven’t see before:

?occupation wdt:P31/wdt:P279* wd:Q66811410

While we are at it, let’s get an image of the subject if there is one, and find out of there is a wikipedia article about the subject. And, since we want a map, we add that as our default view at the top.

Plaques - map of female medics
Plaques – map of female medics

This gives us the following output:

Map view of female medics

Try it

Changing this query to male (Q6581097) or choosing different types of professions is straightforward.

Statistical analysis

The Wikidata Query Service allows us to move beyond visualising the data in different ways. Let’s have a look at a couple of examples.

Analysing who or what is commemorated

The following query finds out what the subject of the plaque is an instance of (P31) – line 6:

Plaque - query seven
Plaque – query seven

but instead of creating a list, it use the COUNT () function to analyse the subject being an instance of (P31) Instance Of.

Try it

We can see that we have 105 humans, 5 lanes etc. Note that some double counting occurs. Some structures, for example, are instances of two things.

We can also analyse the gender of the human subjects just by changing P31 in the above to P21 (Sex or Gender).

At present I get

Plaques by gender
Plaques by gender

That’s far from gender equality, isn’t it!

What’s in a name?

Ascertaining the most common first names on plaques is also straightforward.

We use P735 (given name) statement, get the labels, count and group by those.

Try it.

We get the following results

Plaques - given names chart
Plaques – given names chart

With 81% of plaques to people being for males it is hardly surprising that our league table of names begins with James, William, George, John, Alexander ….

We can do more sophisticated analysis too.

Analysing Occupations

We can add the following line to our query to get back the occupation of the subject of the plaque:

 ?subject wdt:P106 ?occupation

Bear in mind that many of our plaque subjects are true polymaths. Have a look at Robert Brown. He has 10 listed occupations!

So what are the most common occupations of those people for whom there are plaques? Any guesses?

Let’s use the following query:

Plaques - Using Count()
Plaques – Using Count()

This uses the COUNT () function as well as a GROUP BY clause. The query looks at all of the different occupation labels, counts how many of each there are.

Try it

This returns, by default, a table of values. We can flip to a Bar Chart to make better sense of the data:

Plaques - Bar Chart of occupations
Plaques – Bar Chart of occupations

So, we can see that for those commemorated by a plaque the most common occupations are Physician, Painter, University Lecturer, Writer and so on.

We can add a couple of refinements if we wish. If we want our query to default to a BarChart when we run it we can add the following line at the start of the query:

#defaultView:BarChart

and if we want the table to be sorted by value we can add a line such as

ORDER BY DESC (?count)

Try it

What next?

Over the last month I’ve been busy gathering data, taking photographs and publishing all of those on WikiData and wiki Commons. That phase is not quite complete, if it ever could be considered complete. You can monitor live progress here.

There are a couple of photographs which I can’t easily take which I know Aberdeen City Council’s Museum and Galleries team have. It would be great to see those made available by them on Wiki Commons, as I have shared the 148 plaque photos I have taken.

I know of at least 24 more plaques which I have photographed which are not listed yet in Wikidata.

When I published part one of this series I got some great feedback on Twitter. One suggestion is that we add structured data to the Wiki Commons pages for each photograph. Another was to add further data to the record for each plaque using statement P276 (location) where the plaque is on a known listed building. So far I have done that for 5 plaques – check it for yourself. There are loads more to do.

Many of the people records that I have created in Wikidata are skeletal. They need more detail, photographs, biographical links etc. Similarly, given that people or places are noteworthy enough to merit a plaque, they should pass the notability test for Wikipedia, yet at least 68 plaque subjects have no Wikipedia entry.

And plaques are just a start – an easy introduction to what is possible given, in this case, about 100 hours of work. While that was almost all done by one person, if we ran a Code The City weekend on a similar theme and similar sized challenge, six people could achieve the same over a weekend with a little coordination.

At Code The City, we’re about to start discussions with the local cultural institutions about setting up a more formal alliance for the city (shire?) to help shape how they use digital and data more effectively and grow volunteers with skills and tools to make that happen, which is an exciting note on which to finish this post! Watch this space, as they say.

Ian

We help kids in regeneration areas. What’s one of them?

At CTC we work with ONE Codebase to deliver Young City Coders classes. These are after school activities to encourage young people to get into coding by trying Scratch, Python and other languages in a Coder Dojo like environment.

Inoapps generously gave us some funding to cover costs and donated old laptops (as did the James Hutton Institute) which we cleaned up and recycled into machines they could use.

All of which is great – and we have 20-25 kids each session starting to get into these coding languages.

The Challenge

But there is an issue – the bulk of our kids are overwhelmingly from west-end schools. And we have an aim to help kids in regeneration areas where opportunities are generally fewer.

So, that means identifying Aberdeen schools that fall in the regeneration areas and contacting the head teacher and having a discussion about what help they would like to see us provide. Simple?

No.

Search for regeneration areas

Starting with the basics – what are the regeneration areas of Aberdeen? According to Google, the Aberdeen City Council website doesn’t tell us. Certainly not in the top five pages of results (and yes, I did go down that far).

Google’s top answer is from the Evening Express article which says that there are five regeneration areas: Middlefield, Woodside, Tillydrone, Torry and Seaton. From what I have heard that sounds like it might be about right – but surely there is an official source of this.

Further searching turns up a page from Pinacl Solutions who won a contract from ACC to provide wifi in the Northern regeneration areas of “Northfield, Middlefield, Woodside and Tillydrone.” Which raises the question of whether Northfield is or isn’t a sixth regeneration area.

The Citizens Advice Bureau Aberdeen has an article on support services for regeneration areas of “Cummings Park, Middlefield, Northfield, Seaton, Tillydrone, Torry, Woodside and Powis.” That adds two more to our list.

Other sites report there being an “Aberdeen City Centre regeneration area.” Is that a ninth?

Having a definitive and authoritative page from ACC would help. Going straight to their site and using the site’s own search function should help. I search for “regeneration areas” and then just “regeneration.”

ACC results for regeneration areas

I get two results: “Union Street Conservation Area Regeneration Scheme” and “Buy Back Scheme”. The latter page has not a single mention of regeneration despite the site throwing up a positive result. The former appears to be all about the built environment. So it is probably not a ninth one in the sense that the others are. Who knows?

So what are the regeneration areas – and how can I find which schools fall within them?

Community Planning Aberdeen

Someone suggested that I try the Community Planning Aberdeen site’. Its not having a site search wasn’t very helpful but using Google to restrict only results from that domain threw up a mass of PDFs.

After wading through half a dozen of these I could find no list or definition of the regeneration areas of the city are. Amending the query to a specific “five regeneration areas” or “eight….” didn’t work.

Trying “seven regeneration areas” did return this document with a line: “SHMU supports residents in the seven regeneration areas of the city.” So, if that is correct then it appears there are seven. What they are – and which of the eight (or nine) we’ve found so far is not included – is still unknown.

Wards, neighbourhoods, districts, areas, school catchment areas

And – do they map onto council wards or are they exact matches for other defined areas – such as neighbourhoods?

It turns out that there are 13 council wards in the city. I had to manually count them from this page. I got there via Google as search the ACC site for Council Wards doesn’t get you there.

I seem to remember there were 37(?) city neighbourhoods identified at one time. To find them I had to know that there were 37 as searching for “aberdeen neighbourhoods’ wasn’t specific enough to return any meaningful list or useful page.

And until we find our what the regeneration areas are, and we can work out which primary and secondary schools fall in those areas, we can’t do very much. Which means that the kids who would benefit from code clubs most don’t get our help.

I though this would be easy!

At the very minimum I could have used a web page with a list of regeneration areas and some jpg maps to show where they are. That’s not exactly hard to provide. And I’d make sure that the SEO was done in a way that it performed well on Google (oh and I’d sort the site’s own search). But that would do at a pinch. Sticking at that would miss so many opportunities, though.

Better would be a set of Shape Files or geojson (ideally presented on the almost empty open data platform) with polygons that I could download and overlay on a background map.

That done I could download a set of school boundaries (they do exist here – yay) and overlay those and workout the intersections between the two. Does the school boundary overlap a regeneration area? Yes? If so, it is on our target list to help.

Incidentally what has happened to the ACC online mapping portal?  Not only does it not appear in any search results either, but all of the maps except the council boundary appear to have vanished, and there used to be dozens of them!

Lack of clarity helps no-one

A failure to publish information and data helps no-one. How can anyone know if their child’s school is in a regeneration area. How can a community group know if they are entitled to additional funding.

Without accurate boundary maps – and better still data – how can we match activities to physical areas (be they regeneration areas, wards, neighbourhoods, or catchment areas)?

How can we analyse investment, spending, attainment, street cleanliness, crime, poverty, number of planning applications, house values, RTAs per area if we can’t get the data?

For us this is a problem, but for the kids in the schools this is another opportunity denied.

Just as we highlighted in our previous post on recycling, the lack of open data is not an abstract problem. It deprives people of data and information and stifles opportunities for innovation. Our charity, and our many volunteers at events can do clever stuff with the data – build new services, apps, websites, and act as data intermediaries to help with data literacy.

Until there is a commitment nationally (and at a city level) to open data by default we will continue to highlight this as a failing by government.

——————————-

The header image for this page is for a map of secondary school boundaries from ACC Open Data, on an Open Street Map background.


Boundaries, not barriers

Note: This blogpost first appeared on codethecity.co.uk in January 2019 and has been archived here with a redirect from the original URL. 

I wrote some recent articles about the state of open data in Scotland. Those highlighted the poor current provision and set out some thoughts on how to improve the situation. This post is about a concrete example of the impact of government doing things poorly.

Ennui: a great spur to experimentation

As the Christmas ticked by I started to get restless. Rather than watch a third rerun of Elf, I decided I wanted to practice some new skills in mapping data: specifically how to make Choropleth Maps. Rather than slavishly follow some online tutorials and show unemployment per US state, I thought it would be more interesting to plot some data for Scotland’s 32 local authorities.

Where to get the council boundaries?

If you search Google for “boundary data Scottish Local Authorities”  you will be taken to this page on the data.gov.uk website. It is titled “Scottish Local Authority Areas”  and the description explains the background to local government boundaries in Scotland. The publisher of the data is the Scottish Government Spatial Data Infrastructure (SDI). Had I started on their home page, which is far from user-friendly, and filtered and searched, I would have eventually been taken back to the page on the data.gov.uk data portal.

The latter page offers a link to “Download via OS OpenData” which sounds encouraging.

Download via OS Open Data

This takes you to a page headed, alarmingly, “Order OS Open Data.” After some lengthy text (which warns that DVDs will take about 28 days to arrive but that downloads will normally arrive within an hour), there then follows a list of fifteen data sets to choose. The Boundary Line option looked most appropriate after reading descriptions.

This was described as being in a proprietary ERSI shapefile format, and being 754Mb of files, with another version in the also proprietary Mapinfo format. Importantly, there was no option for downloading data for Scotland only, which I wanted. In order to download it, I had to give some minimal details, and complete a captcha. On completion, I got the message, “Your email containing download links may take up to 2 hours to arrive.”

There was a very welcome message at the foot of the page: “OS OpenData products are free under the Open Government Licence.” This linked not to the usual National Archives definition, but to a page on the OS site itself with some extra, but non-onerous reminders.

Once the link arrived (actually within a few minutes) I then clicked to download the data as a Zip file. Thankfully, I have a reasonably fast connection, and within a few minutes I received and unzipped twelve sets of 4 files each, which now took up 1.13GB on my hard drive.

Partial directory listing of downloaded files

Two sets of files looked relevant: scotland_and_wales_region.shp and scotland_and_wales_const_region.shp. I couldn’t work out what the differences were in these, and it wasn’t clear why Wales data is also bundled with Scotland – but these looked useful.

Wrong data in the wrong format

My first challenge was that I didn’t want Shapefiles, but these were the only thing on offer, it appeared. The tutorials I was going to follow and adapt used a library called Folium, which called for data as GeoJson, which is a neutral, lightweight and human readable file format.

I needed to find a way to check the contents of the Shapefiles: were they even the ones I wanted? If so, then perhaps I could convert them in some way.

To check the shapefile contents, I settled on a library called GeoPandas. One after the other I loaded scotland_and_wales_region.shp and scotland_and_wales_const_region.shp. After viewing the data in tabular form, I could see that these are not what I was looking for.

So, I searched again on the Scottish Spatial Infrastructure and found this page. It has a Download link at the top right. I must have missed that.

SSI Download Link
SSI Download Link

But when you click on Download it  turns out to be a download of the metadata associated with the data, not the data files. Clicking Download link via OS Open Data, further down page, takes you back to the very same link, above.

I did further searching. It appeared that the Scottish Local Government Boundary Commission offered data for wards within councils but not the councils’ own boundaries themselves. For admin boundaries, there were links to OS’ Boundary Line site where I was confronted by same choices as earlier.

Eventually, through frustration I started to check the others of the twelve previously-downloaded Boundary Line data sets and found there was a shape file called “district_borough_unitary_region.shp” On inspection in GeoPandas it appeared that this was what I needed – despite Scottish Local Authorities being neither districts nor boroughs – except that it contained all local authority boundaries for the UK – some 380 (not just the 32 that I needed).

Converting the data

Having downloaded the data I then had to find a way to convert it from Shapefile to Geojson (adapting some code I had discovered on StackOverflow) then subset the data to throw away almost 350 of the 380 boundaries. This was a two stage process: use a conversion script to read in Shapefiles, process and spit out Geojson; write some code to read in the Geojson, covert it to a python dictionary, match elements against a list of Scottish LAs, then write the subset of boundaries back out as a geojson text file.

Code to convert shapefiles to geojson

Using the Geojson to create a choropleth map

I’ll spare the details here, but I then spent many, many hours trying to get the Geojson which I had generated to work with the Folium library. Eventually it dawned on me that while the converted Geojson looked ok, in fact it was not correct. The conversion routine was not producing the correct Geojson.

Another source

Having returned to this about 10 days after my first attempts, and done more hunting around (surely someone else had tried to use Scottish LAs as geojson!) I discovered that Martin Crowley had republished on Github boundaries for UK Administrations as Geojson. This was something that had intended to do for myself later, once I had working conversions, since the OGL licence permits republishing with accreditation.

Had I had access to these two weeks ago, I could have used them. With the Scottish data downloaded as Geojson, producing a simple choropleth map as a test took less than ten minutes!

Choropleth map of Scottish Local Authorities

While there is some tidying to do on the scale of the key, and the shading, the general principle works very well. I will share the code for this in a future post.

Some questions

There is something decidedly user-unfriendly about the SDI approach which is reflective of the Scottish public sector at large when it comes to open data. This raises some specific, and some general questions.

  1. Why can’t the Scottish Government’s SDI team publish data themselves, as the OGL facilitates, rather than have a reliance on OS publishing?
  2. Why are boundary data, and by the looks of it other geographic data, published as ESRI GIS shapefiles or Mapinfo formats rather than the generally more-useable, and much-smaller, GeoJson format?
  3. Why can’t we have Scottish (and English, and Welsh) authority boundaries as individual downloads, rather than bundled as UK-level data, forcing the developer to download unnecessary files? I ended up with 1.13GB (and 48 files) of data instead of a single 8.1MB Scottish geojson file.
  4. What engagement with the wider data science / open community have SDI team done to establish how their data could be useful, useable and used?
  5. How do we, as the broader Open Data community share or signpost resources? Is it all down to government? Should we actively and routinely push things to Google Dataset Search? Had there been a place for me to look, then I would have found the GitHub repo of council boundaries in minutes, and been done in time to see the second half of Elf!

And finally

I am always up for a conversation about how we make open data work as it should in Scotland. If you want to make the right things happen, and need advice, or guidance, for your organisation, business or community, then we can help you. Please get in touch. You can find me here or here or fill in this contact form and we will respond promptly.

So, how did CTC6 – The History Jam go?

Intro

On 19th and 20th March we found ourselves back at Aberdeen Uni with 35 or so eager hackers looking to bring to life a 3D Virtual Reality historic model of Aberdeen city centre using new open data. So how did it go?

This time we were more prescriptive than at any previous Code The City event. In the run up to the weekend we’d identified several sub-team roles.

  • Locating, identifying and curating historic content
  • Transcribing, formatting and creating valid open data
  • Building the 3D model, fixing and importing images and
  • Integrating and visualising the new data in the model.
Andrew Gives us an Open Data Briefing

After some breakfast, an intro and a quick tutorial on Open Data, delivered by Andrew Sage, we got stuck in to the work in teams.

Old Books into Open Data

We were lucky to have a bunch (or should be a shelf-ful) of city librarians, an archivist and a gaggle of other volunteers working on sourcing and transcribing data into some templates we’d set up in Google Sheets.

Given that we’d been given scanned photos of all the shop frontages of Union Street, starting in 1937, of which more below, we settled on that as the main period to work from.

The Transcribers
The Transcribers

The librarians and helpers quickly got stuck into transcribing the records they’d identified – particularly the 1937-38 Post Office Directory of Aberdeen. If my arithmetic is correct they completely captured the details of 1100+ business in the area around Union Street.

At present these are sitting in a Google Spreadsheet – and we will be working out with the librarians how we present this as well structured, licensed Open Data. It is also a work in progress. So there are decisions to be made – do we complete the transcription of the whole of Aberdeen – or do we move onto another year? e.g. 1953 which is when we have the next set of shopfront photos.

We have a plan
We have a plan

Music, pictures and sound

At the same time as this transcription was ongoing, we had someone sourcing and capturing music such might have been around in 1937, and sounds that you might have heard on the street – including various tram sounds – which could be imported into the model.

Sounds of the city
Sounds of the city

And three of us did some work on beginning an open list of gigs for Aberdeen since the city had both the Capitol Theatre (Queen, AC/DC, Hawkwind) and the Music Hall (Led Zeppelin, David Bowie, Elton John) on Union Street. This currently stands at 735 gigs and growing. Again, we need to figure out when to make it live and how.

The 3D Model

At CTC5 back in November 2015, Andrew Sage had started to build a 3D model of the city centre in Unity. That relied heavily on manually creating the buildings. Andrew’s idea for CTC6 was to use Open Streetmap data as a base for the model, and to use some scripting to pull the building’s footprints into the model.

Oculus Rift Headset and a 1937 Post Office Directory

This proved to be more challenging than expected. Steven Milne has written a great post on his site. I suggest that you read that then come back to this article.

As you’ve hopefully just read, Steve has identified the challenge of using Open Streetmap data for a project such as this: the data just isn’t complete enough or accurate enough to be the sole source of the data.

While we could update data – and push it back to OSM, that isn’t necessarily the best use of time at a workshop such as this.

An alternative

There is an alternative to some of that. All 32 local authorities in Scotland maintain a gazetteer of all properties in their area. These are highly accurate, constantly-update, and have Unique Property Reference Numbers (UPRNs) and geo-ordinates for all buildings. This data (if it was open) would make projects such as this so much easier. While we would still need building shapes to be created in the 3D model, we would have accurate geo-location of all addresses, and so could tie the transcribed data to the 3d map very easily.

By using UPRNs as the master data across each transcribed year’s data we could match the change in use of individual buildings through time much more easily.  There is a real need to get the data released by authorities as open data, or at least with a licence allowing generous re-use of the data. ODI Aberdeen are exploring this with Aberdeen City Council and the Scottish Government

Fixing photos

We were given by the city’s Planning Service, scans of photos of shopfronts of Union Street from a number of decades from 1937, 1953 and on to the present. Generally the photos are very good but there are issues: we have seams between photos which run down the centre of buildings. We have binding tape showing through etc.

A split building on Castle Street.

These issues are not so very difficult to fix – but they do need someone with competence in Photoshop, some standard guidance, and workflow to follow.

We started fixing some photos so that they could provide the textures for the building of Union Street in the model. But given the problems we were having with model, and a lack of dedicated Photoshop resource we parked this for now.

Next steps

Taking this project forward, while still posing some challenges, is far from impossible. We’ve shown that the data for the entire city centre for any year can be crowd-transcribed in just 36 hours. But there are some decisions to be made.

Picking up on the points above, these can be broken down as follows.

Historical Data

  • Licensing model to be agreed
  • Publishing platform to be identified
  • Do we widen geo-graphically (across the city as a whole) or temporally (same area different years)
  • Creating volunteer transcribing teams, with guidance, supervision and perhaps a physical space to carry out the work.
  • Identify new data sources (e.g. the Archives were able to offer valuation roll data for the same period – would these add extra data for buildings, addresses, businesses?)
  • Set up a means for the general public to get involved – gamifying the transcription process, perhaps?

Photos

  • Similar to the data above.
  • We need clear CC licences to be generated for the pictures
  • Crowdsource the fixing of the photos
  • Create workflow, identify places for the pictures to be stored
  • Look at how we gamify or induce skilled Photoshop users to get involved
  • Set up a repository of republished, fixed pictures, licensed for reuse, with proper addressing system and naming  – so that individual pictures can be tied to the map and data sources

The 3D Model

  • Build the model
  • Extend the coverage (geographically and through time)
  • Establish how best to display the transcribed data – and to allow someone in the 3D environment to move forward and back in time.
  • Look at how we can import other data such as a forthcoming 3D scan of the city centre to shortcut some development work
  • Look at how we can reuse the data in other formats and platforms (such as Minecraft) with minimum rework.
  • Speed up the 3D modelling by identifying funding streams that could be used to progress this more quickly. If you have suggestions please let us know as a comment below.

Taking all of this forward is quite an undertaking, but it is also achievable if we break the work down into streams and work on those. Some aspects would benefit from CTC’s involvement – but some could be done without us. So, libraries could use the experience gained here to set up transcribing teams of volunteers – and be creating proper open data with real re-use value. That data could then easily be used by anyone who wants to reuse it – e.g. to create a city centre mobile app which allows you to see any premises on Union Street, call up photos from different periods, find out which businesses operated there etc

As the model takes shape and we experiment with how we present the data we can hopefully get more attention and interest (and funding?) to support its development. It would be good to get some students on placements working on some aspects of this too.

Aberdeen City Council is working with the Scottish Cities Alliance to replace and improve the Open Data platforms for all seven Scottish cities later this year – and that will provide a robust means of presenting and storing all this open data once in place but in the mean time we will need to find some temporary alternatives (perhaps on Github ) until we are ready.

We welcome your input on this – how could you or your organisation help, what is your interest, how could you assist with taking this forward? Please leave comments below.

Code The City 6 – The History Jam was funded by Aberdeen City Council’s Libraries service and generously supported by Eventifier who provided us with free use of their Social Media platform and its LiveWall for the sixth consecutive time!.