
Introduction
According to the last air quality report for Aberdeen, we have some of the worst air in Scotland. Even though we live on the coast, and generally have a nice breeze, we still have bad air days. Particulate matter is so small that we can’t see the risks: clear air does not mean clean air. This leads to health issues for some of us, and our families. It also affects how busy the health services are too.
There are some official monitors available for the city, but they don’t have widespread coverage. This means you are unlikely to be able to check the air quality around your house, your child’s school, your cycle commute or where you go running. With your help we would like to change that.
Clean Air Aberdeen sprang from our February Code The City co-design event focusing on air quality. Then, we built some sensors, developed some analytics, and explored how to take this work further. At the end the participants wanted this to continue through an ad-hoc organisation aimed at monitoring air quality in Aberdeen. The data from every sensor is published as open data which can be used to create new products and services.
Making this weekend happen
We’re immensely grateful to Forty Two Studio for sponsoring the catering for the weekend, which covered breakfast and lunch each day and pizza and beers at Saturday evening. With almost 30 on day one and 25 on day two the costs really mount up. And an army marches on it stomach, so without their generosity we couldn’t have fed everyone! Thanks, guys.
Similarly, when we made an appeal for further sensors, both Codify and Converged Communications donated funding for ten more devices each, which is very generous. Thank you!
What we did this time
In advance of the event we had invited attendees to seed ideas on our ideas platform. From these, we printed out A3 sheets and pinned those on the wall ahead of anyone arriving. Attendees, some of whom had not interacted with the online system, were invited to add fresh ideas or comment on existing ones.
Everyone voted on what their favourite three things were, allowing us to identify the top projects. People then volunteered to champion one of the top ones and teams were formed to work on these over the two days.
Open, open, open
At Code The City we champion not only open data, and working openly but also open source – and so every project team was provided with a Github repo in which to capture and share code and digital artefacts.
Sensor Build Workshops
Our friends from 57 North Hacklab led three sensor build workshops over the weekend. Those who had bought a ticket to make their own device constructed it under supervision and took it home with instructions to make it live. Some of the Saturday-built ones were online by the time we got back together on Sunday morning!
The projects
In addition to the sensor building workshops we had five teams working on their projects. These are listed below. In each case their team name links straight to their project’s GitHub repo.
Webby-Wonders
The team worked on rewriting the website for Air Aberdeen so that it provides more information for visitors, including how they can get involved.
Implaqable
This small team explored how to persuade people to ‘do the right’ thing to help improve air quality. Their work fed directly into the web team’s project, and by the end of the event they were practically working as one larger team.

Data-Gathering
This team explored API development to pull sensor data for specified dates.
Air-Champs
This unit set out to visualise the data with dashboards to make it easier to see the air that matters to you.
Mike-And-Robb
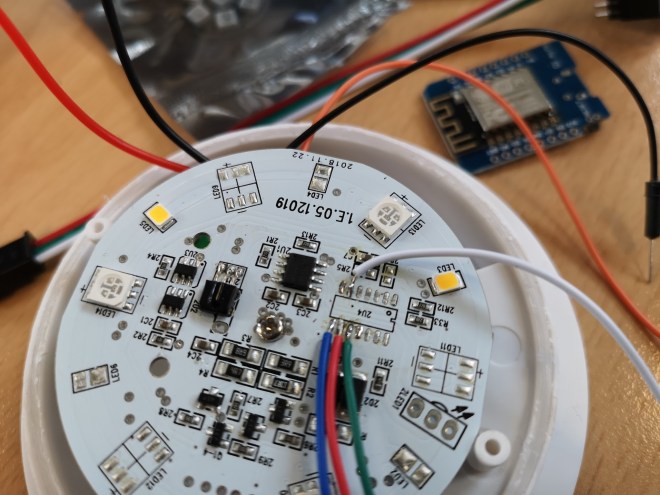
This team worked with hardware to help visualise air quality in a variety of ways. They started with two mini-projects but settled on hacking some LED house table-lamps. By removing the controller chips and hooking them up to an external controller they were able to have the colour of the lamp reflect the air quality of the surrounding area.
Teasing out common aspects
During the weekend, with several teams working on what were (or should be) interlocking projects, we did a quick bit of intervention, pulling teams together and facilitating some commonly agreed approaches. We came up with a couple of models of how we saw the infrastructural components stack up.
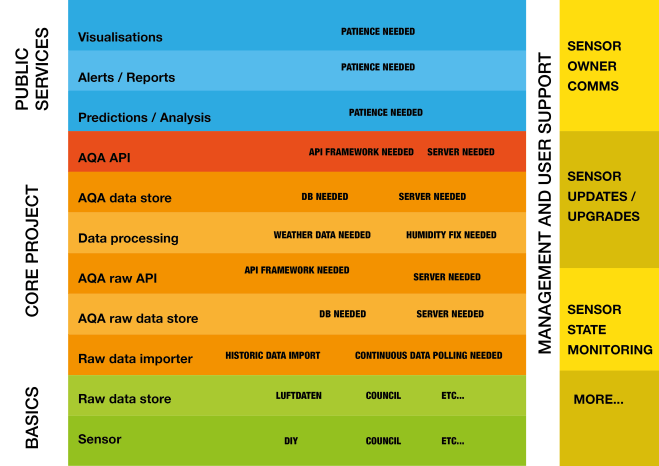
The diagram above shows the layers of infrastructure and APIs from the original Luftdaten data at the bottom to the ‘fancy stuff’ at the top. This refocussed teams’ efforts to get the basics right so that they could be built on.
Weather or not
We know that the sensors tend to over-measure PM values when the relative humidity (RH) is high. We have still some work to do in the data processing layer, above, to gather better weather data, to do calculations and, if necessary, adjust PM values. A single one-person team set out to download weather data, but vanished. We need to revisit this.
Where are the sensors?
We identifed at the start of the workshop that our project had about 17 sensors in the city and the local council just 6. Where are they? Are they in the right places? How do we know?
We plotted on a paper map where the sensors are – and this has since been translated into web-enabled made built in Leaflet. We’ve screen-shotted it below. A couple are off the screen in this picture.

The data behind this is a few days out of date, so the fifteen red sensors shown (ours) omit a few that have gone live this week. The five green ones (the council’s) have been static for several years. What is clear that even with our ones now live there are large swathes of Aberdeen with no AQ sensors within a considerable distance.
What’s next
Coming out of the weekend there are a number of tasks which we need to work on next. These will be the subject of a blog post in the next few days.
