Aberdeen Plaques – Part One

On Saturday 14th December 2019 we ran a one-day mini hack event. The idea behind it was for people to come along for a day to work on their side projects and, if they needed support, attempt to persuade others to assist them.

That’s what I did with my Aberdeen Plaques project: something I’d had on the back burner for more than a year.

Why do it?

The commemorative plaques which are dotted around the city are a perfect candidate for open data. They have a subject, usually some dates, are located somewhere, and are of different types etc. Making that all available as open data would open up a whole range of possibilities.

Some Aberdeen plaques

If we captured all of that well then we could do analysis on the data (ratio of women to men, most represented professions), create walking routes (maybe one for the arts, one for the sciences and so on), create timelines to see what periods are more represented.

Having recently trained as a WikiMedia UK trainer – and having experimented with some of the tools (Wiki Commons, Wiki Data, Wikipedia, Histropedia) I was convinced that these were the right way to go.

Pre-event prep

So, in advance of the hack day I’d done a bit of prep in the two weeks running up to the day iteself.

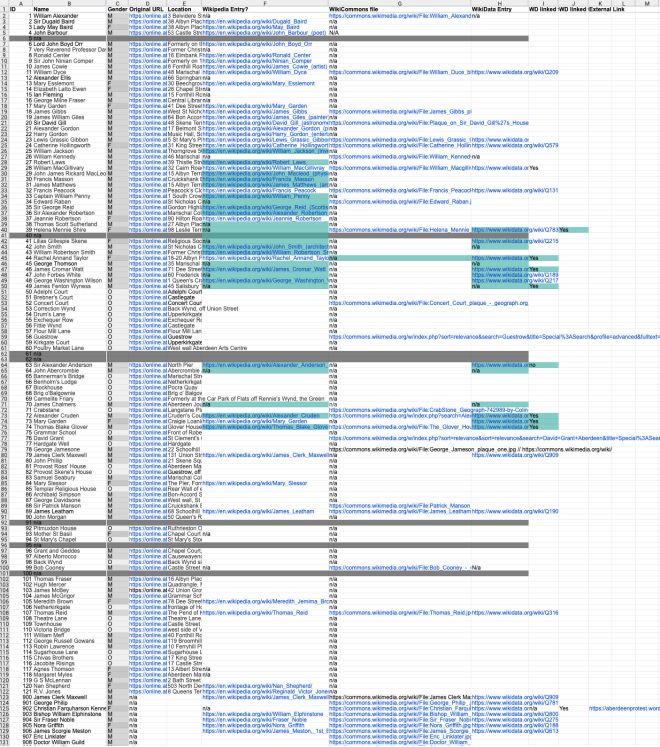
I’d created a spreadheet which recorded the
* subject (person or ‘thing’)
* Gender if known
* the link to the now-retired city council plaques system (hidden from public view)
* The location if known
* The geo coordinates (to be determined)
* Whether the subject had a Wikipedia page (tbd)
* Whether there was an image of the plaque on Wiki Commons (tbd)
* Whether the subject of the plaque was represented on Wiki Data (tbd)
* Any identifiers on Open Plaques (tbd)
* Any external links (eg to Flickr for photos)

I’d then populated some of the data (eg whether there were images of the plaque on Wiki Commons) as well as some other bits. But most cells were blank.

Pre-event spreadsheet

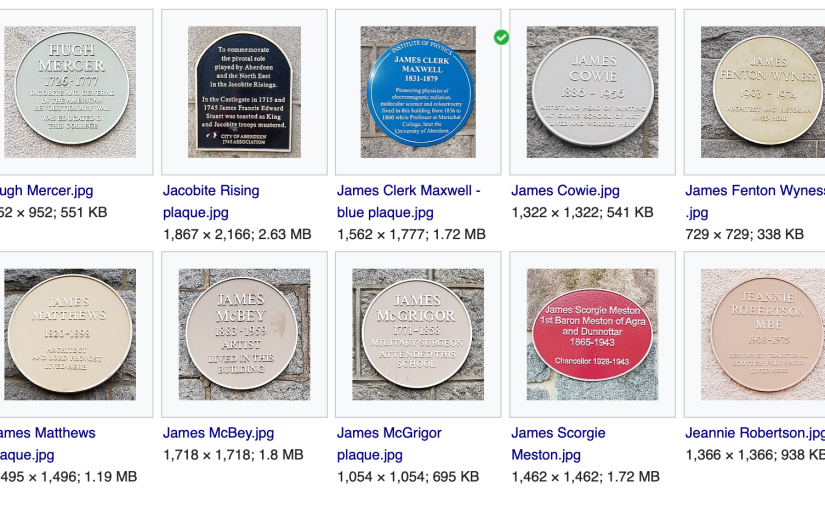
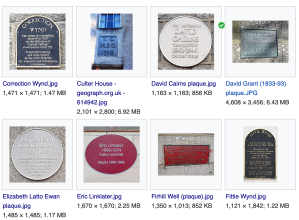
As a keen walker and photographer I had also photographed and uploaded seventeen plaque images to Wiki Commons in the lead up, so that we would have some images to work with.

How to use our time most effectively on the day?

Our aim for the day was then to find out what data / info / images existed, fill in the gaps, and explore how to use WikiData to store and retrieve data, and how we could potentially create maps, timelines and similiar new products.

What we did on the day

At the start of the event we pitched our project ideas, and I managed to persude five others (Angela, Mike, Stephen, James and Steve) to join me in working on the plaques project.

Angela and Mike, and later Angela and Stephen would go out and take photographs. Steve, James and I would work on the data capture, completing research on what existed, creating new entries for the data on Wiki Data, and testing queries on the Wiki Data query service.

How we did it

We used the spreadsheet that I had set up to capture all of the data we’d gathered – and as it eveolved it would show progress as well as what was still lacking. We had no expectations that we would do it all on the day, but we could pick away at it in future weeks and months.

In the run-up to the event I’d discovered The Pingus’ album of plaques photographs on Flickr. Sadly these had not been published with a licence that would allow us to use them. I’d sent a request, a few days before CTC18, for them to change the licence for the Aberdeen plaques pictures to a CC-SA one. This would have allowed our republishing on Wiki Commons. Sadly it didn’t elicit a response. But the album did show that there were many more plaques than the old ACC system listed. And it was possible to get co-ordinates from them. So the number of plaques to deal with kept growing.

During the day James filled in loads of gaps in which subjects were on Wikipedia and which on Wikidata.

Steve and I experimented with capturing and querying the data. Structuring that in a way that aids recall through Wiki Data Query Service was an interative process. Firstly I tried adding a statement ‘commomorative plaque image’ (P1801) into the wikidata record for the subject as you can see in this first example https://www.wikidata.org/wiki/Q2095630. But that limited what we could do.

So, we discovered that we could create a new object which was an instance of commemorative plaque. Our first attempt was https://www.wikidata.org/wiki/Q78438703 and we evolved what we captured there – adding statement, and Steve discovered the ‘openPlaques plaque ID'(P1893). Incidentally we also tried ‘openplaques Subject ID’ (P1430) but adding that to the plaque object throws an error. The latter should be added to the person record not the plaque.

At the end of CTC18

We ended the day with

  • 138 plaques listed.
  • 57 sets of co-ordinates identified
  • 68 Wikipedia articles identified as matching plaque subjects (and eleven plaques subjects who had NO wikipedia page)
  • 36 Images in WikiCommons
  • 77 WikiData entries for the subject of the plaques (existing or created)
  • 11 new wikidata entries for the plaques themselves

This was a great leap forward in one day and would pave the way for future work.

What next?

Since CTC18 ended, I’ve got firmly stuck into this project over the xmas break. Over the last three weeks I have now photographed over a hundred plaques (plenty of walking) and have created wikidata entries for most plaques and also their subjects in wikidata.

I’ll cover all of that, and how we can now use the data in part two, coming soon.

Code the City 12 – Tourism

The Challenge

Tourism is vital to the local economy. While loads of tourists pass through Aberdeen we could do so much more to make it a destination of choice.

The featured image above is how we used to attract tourists to Aberdeen. How should we do it now? What role does design, marketing, technology or data play in new interactions with tourists?

Who should attend?

Anyone – despite our name, coding is a small bit of what we do.

Of course, coders, data wranglers, designers and other techies are important to a hack weekend.

We’d be delighted to see you if:

  • You work in the tourism sector, operating attractions, providing accomodation or other services
  • You have identified a problem with service delivery, or see an opportunity to do things better!
  • You have an interesting in service design
  • You work or study in the creative industries
  • You have experience as a tourist in Aberdeen or anywhere else
  • You are someone who wants to do more with data but isn’t sure where to start
  • You are a student (of any discipline)
  • You are someone who wants to improve the local area, or use digital and skills to improve local services
  • You are from the third sector or local government
  • You work with mapping, GIS, or location data
  • You are curious about learning new techniques and skills to use in your day job, and finally
  • And, of course, if you are a developer, designer, UX expert, data wrangler, coders, or service designer

So it’s a Toursim hack?

Yes – we’ll be identifying opportunities and barriers to making Aberdeen City and Shire a destination of choice for tourists, creating projects, teams and prototypes to address those. Some of those will turn into coding projects – and some will all be about research, service design and paper prototyping.

Timings

The event will run Saturday 9.30am to about 5pm, then Sunday 9.30 to about 4.30pm.

What happens over the weekend?

* identification of opportunities and barriers

* ideation to address those

* creation of project teams to work on those

* agile prototyping of solutions, so that by close of play Sunday we will have demonstrable solutions which could be developed into real worls products or services.

But, a ticket will cost £5 (*)

What do you mean, it’s not free? CTC is usually free!

At CTC 11 in December we broke with a tradition established over the previous 10 events and charged a small amount to attend. The reasone was that in a couple of recent CTC events we had higher than normal numbers of people booking free tickets and not showing up. That meant we over-catered, and despite our best efforts we had left-over food, which is a bad thing and wastes money too.

So, we attached a monetary value to the ticket (* backed up by our promise that those attending would get their  money back when they showed up). And it worked. The bookings didn’t go down. Fewer people dropped out. We didn’t waste food and we banked the money that went unclaimed. A few generous individuals recognising our new charity status even refused their money back, which was nice.

Tickets

You can get tickets here (on Eventbrite).

Location & Getting There

We’ll be at the Sir Ian Wood Building at Robert Gordon University’s Garthdee Campus. You can get a No 1 bus from King Street / Union Street which will take you into the campus and drop you at the door. Or you can get a No. 2 bus which will drop you at the gates to the campus.

If you must drive, then parking is free and open at weekends on campus.

Sponsorship

Robert Gordon University will be sponsoring this event. We could do with another sponosor or two to make sure we cover all costs. If you would like to sponsor it, get in touch with @codethecity on Twitter.

We look forward to seeing you in February!

Ian, Steve, Andrew and Bruce.

Code the City

Registered Charity in Scotland: SC047835

Journeygrid

“We should build one for here!”

So starts another Codethecity conversation on discovering a neat data driven tool. This time it’s the excellent New York subway toy created by Jason Wright.

Brand_New_Subway

The tool allows you to redesign transit provision in the city by building new subway routes. By adding new stations. By removing or moving existing lines.

It’s addictive and fascinating.

As is so often the case, we then start riffing on what it could also do. It could time travel using that tram data we have from the early 1900s. It could give alternate route options if we hook up to that academic project we spoke with earlier in the year. It could carbon count. It could give safety information for cyclists. We could data collect with a new app to feed it improved validation data…

Before we have the cake we’re discuss how pretty the icing will look.

In reality what we should be looking at is the bottom layer. The underpinnings.  The data.

Where do people live? Where do they work? Where do they school run? Where is the football stadium and where do the fans live? Where are the shops and where is the money?

We’re going to start with the commute. Where do people start, spend, and end their day? How do they move around? And when? No agenda. No grand insights planned. Just a good solid data gathering and modelling project.

We’re calling it journeygrid.

journeygrid open data transportation project

If you have any data, or methodologies for gathering and storing such data we’d love to speak to you.

You can find out more about the New York Subway project here, and you can play with it here.