
“We should build one for here!”
So starts another Codethecity conversation on discovering a neat data driven tool. This time it’s the excellent New York subway toy created by Jason Wright.
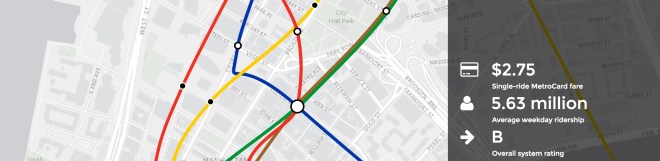
The tool allows you to redesign transit provision in the city by building new subway routes. By adding new stations. By removing or moving existing lines.
It’s addictive and fascinating.
As is so often the case, we then start riffing on what it could also do. It could time travel using that tram data we have from the early 1900s. It could give alternate route options if we hook up to that academic project we spoke with earlier in the year. It could carbon count. It could give safety information for cyclists. We could data collect with a new app to feed it improved validation data…
Before we have the cake we’re discuss how pretty the icing will look.
In reality what we should be looking at is the bottom layer. The underpinnings. The data.
Where do people live? Where do they work? Where do they school run? Where is the football stadium and where do the fans live? Where are the shops and where is the money?
We’re going to start with the commute. Where do people start, spend, and end their day? How do they move around? And when? No agenda. No grand insights planned. Just a good solid data gathering and modelling project.
We’re calling it journeygrid.

If you have any data, or methodologies for gathering and storing such data we’d love to speak to you.
You can find out more about the New York Subway project here, and you can play with it here.
