Opening the data on Aberdeen Convicts – part 1

A guest blog-post by Sara Mazzoli, a post-graduate student at Edinburgh University, who has been interning at Code The City for the last three months. During this project she has worked closely with us and with the Aberdeen City and Aberdeenshire Archives.

Introduction: what is the Register of Returned Convicts?

Historical context, use and description

The Register of Returned Convicts of Aberdeen (1869-1939) is a fascinating, “small-but-chunky” (Astley, 2021) volume contained in the Aberdeen and Aberdeenshire Archives, comprising a total of 279 entries. It is located in the Grampian police collection of the Archives. Out of these entries, about sixty feature mug shots – which can be seen here.

As suggested by the register’s title, the register was used to take note of convicts’ addresses upon release. In fact, Phil Astley – Aberdeen’s Archivist – explained to us that this register contains information on convicts that were sentenced to Penal Servitude (often noted in the register as P.S.). 

The Penal Servitude Act, enforced in 1857, was meant to substitute transportation with a prison sentence. This specific sentence consisted of three parts: solitary confinement; labour and release on licence. This latter element meant that individuals sentenced to P.S. had to report monthly to the police during their licence time. Also, they had to report any change in address within 48 hours. 

A typical page of the Register looks like this:

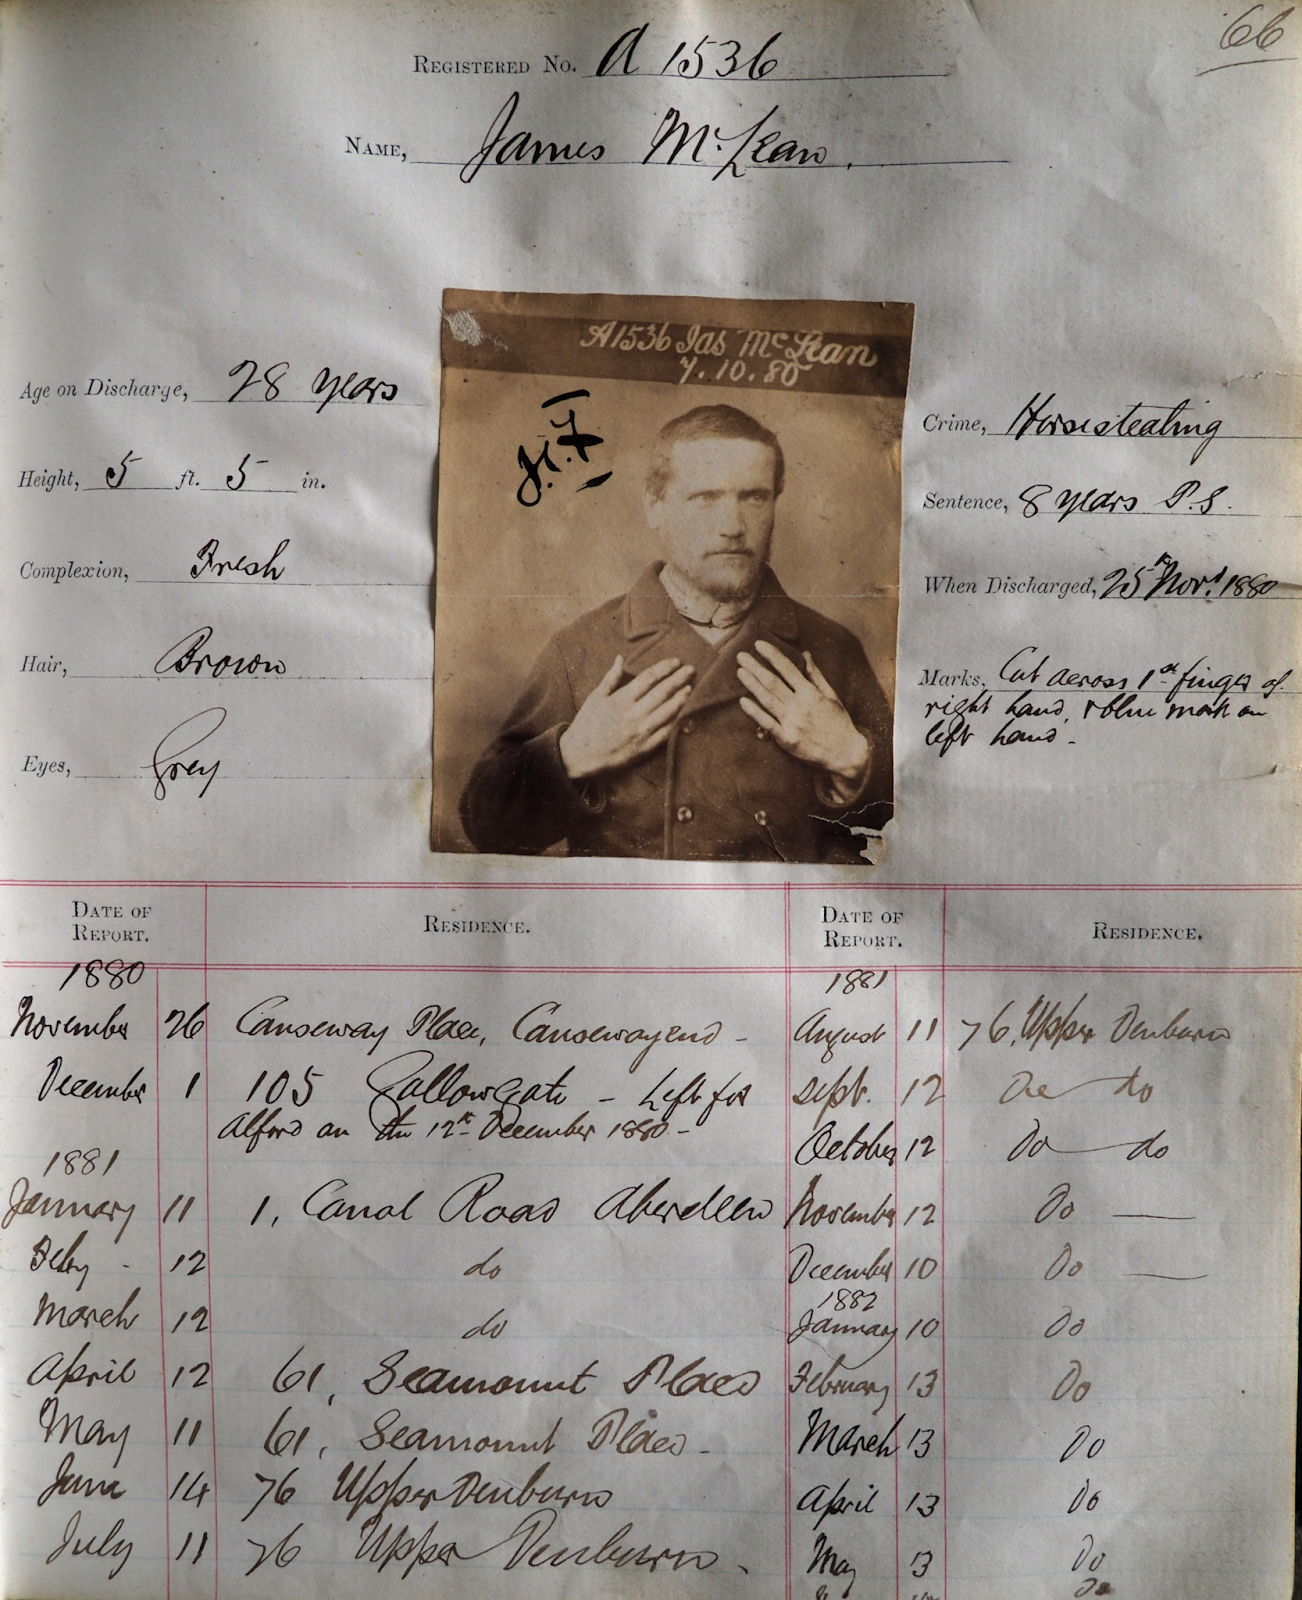
As it can be seen, at the top of each page of the register, information was noted on convicts’ physical traits and age upon release, as well as conviction and sentence. In the “Marks” section, anything noteworthy – such as tattoos, scars, deformities and moles – was written down. In fact, according to Phil Astley the industrialisation process determined a high incidence of accidents in factories. Therefore, disfigurements were common amongst workers. 

At the bottom half of the page, the register featured information on the convicts’ addresses after their sentence ended. Most of the addresses of the people noted in the register were in Aberdeen. However, some also moved to nearby towns and villages – such as Dundee – or to bigger cities, such as Edinburgh and Glasgow. 

Moreover, Phil suggested that there are other two particular acts that shaped the register. 

  • The Habitual Offenders Act 1869. 
  • The Prevention of Crimes Act of 1871. This act 

Simply put, these two acts tightened former criminals’ liberties, and enhanced police monitoring of these individuals. These laws were in fact especially crafted to fight habitual criminals (Radzinowicz and Hood, 1980): with increasing urbanization, authorities were concerned with what they labelled as “criminal classes”, an expression by which they referred to individuals who mainly lived through criminal activities. The Register can ultimately be understood as an example of the attempt to monitor the movements of these repeat offenders.

The mugshots and the “habitual criminal”

The camera was developed in the first half of the Nineteenth century, and was initially seen as a tool to represent bodies in a realistic manner. Indeed, photography was depicted as an objective and neutral representation of reality, and therefore authorities started using this tool for law enforcement since the 1840s: “Given its material features and its cultural value as an objective form of representation, the camera provided the perfect tool for the documentation, classification, and regulation of the body within the carceral network” (Finn, 2009, p. 29). 

Indeed, at first, as the concept of “mug shot” was developing, photos of individuals in the Register lacked a unique formatting, which started to appear in the 1890s. Indeed, as claimed by Finn (2009), mug shots developed from the Nineteenth-century portrait. These portraits featured an individual sitting, with no facial expression, and were usually taken from the front. As it can be seen, the first few mug shots look more like portraits compared to the later ones. For example:

 Fig 1: two mug shots from the Register of the Returned Convicts (1869-1939). The first one, depicts Ann Mc Govern, released in 1872. The second one is the mug shot of John Proctor, discharged in 1893.

According to Holligan and Maitra (2018, p. 173), mug shots were established and developed in a milieu of “pessimism about classes of society”. Moreover, the development of criminal anthropology led to a more wide-spread use of photography in carceral settings. Scholars of this field of studies, such as Cesare Lombroso, believed that certain physical characteristics could yield the identification of criminals. The believed objectivity of photography meant that mug shots could further inform these studies; as characteristics found in mugshots could be analysed by criminal anthropologists. At the same time, the popularity of criminal anthropology led this field of studies also to shape law enforcement practices; first and foremost, by shaping the practices of mug shots taking and of noting distinguishing marks. 

Specifically, mug shots were introduced in the UK thanks to the above-mentioned Prevention of Crimes Act of 1871: “Under the section 7 of the Prevention of Crime Act 1871 it was recommended that convicted prisoners be photographed before release, full and side face,measurements in millimetres and feet and inches to be made of length and width of head, and lengths of arms,feet and left middle finger including the papillary ridges of the ten fingers as well as distinctive marks by position on body” (Holligan & Maitra, 2018, p. 177). Indeed, Holligan and Maitra (2018) contend that the development of criminal anthropology led to the belief that “habitual criminals” could be identified by some specific marks; such as the length of imbs. Some of these marks were collected and published by the British Registry of Distinctive Marks, which regulated and influenced the ways in which authorities saw and noted distinguishing marks on prisoners. 

Ultimately, we aim to argue that this Victorian construction of crime and of the criminal influenced the way in which the register is composed as well, and that the meaning of “crime” and “criminal” are dictated by moral and social standards. Indeed, many were arrested due to charges of Theft “Habit & Repute” which, according to Dr. Darby, means considering someone’s as having a “bad character, a bad name for theft specifically, and that other witnesses considered him a bad person”. Analysing the register means considering those social rules that shaped the way in which the register is written. 

It is in our opinion fundamental to acknowledge such dimensions of the register as we open its data. It is in fact important to recognize that “Registers are political” (Ziegler, 2020), and that therefore the categories of the register are constructed. However, it must also be acknowledged that their construction does not make these categories any less impactful on individuals’ lives.  Indeed, this is why we embrace attempts such as that of Phil, who tried to retrieve the humanity of the individuals in the register by associating their mug shots to stories; as we shall argue in the next paragraph. 

Why this project is important: how did everything start?

Phil Astley explained that the interest in the register was built up during the 2019 and 2020 Granite Noir festival exhibitions, to which the Archives provided 19th century wanted posters, photos of 1930s crime scenes, as well as mug shots contained in the Register. 

Indeed, the mug shots had attracted a positive response, and Phil started the Criminal Portraits blog, in which he started exploring the stories of returned convicts whose mug shots are contained in the register. Therefore, Phil has published more than 50 blog posts, drawing on heterogeneous sources, such as newspapers of the time and censuses. The blog has attracted more than 20 thousand views.

In discussing the plans for this project with Phil and Ian Watt of Code The City we agreed that opening up the data contained in the register – making it available as Open Data – would have social and other benefits. 

According to the Open Data Handbook, open data is data that can be easily available and re-usable by anyone. There are many values pertaining to open data. Indeed, it can allow for more transparency, and therefore institutions’ or organizations’ accountability. Moreover, it can also prompt economic participation and investment by private companies. Finally, open data can enable citizen participation and engagement, as it is with this project. 

In this specific case, we decided to open data from the register precisely because of the public interest it attracted. Not only is the life of the individuals contained in the register fascinating in itself, but we would argue that opening up this data has also a greater social value. For example, it would allow for individuals with a genealogical interest to find out more about their possible ancestors; or it could be useful for researchers who are carrying out their work on criminality in Scotland. 

In any case, opening up data from the Archives could lead to more interest towards their rich collections, as well as to a more thorough understanding of these collections’ communal utility.

It was agreed that we would use Wikidata as the place to host the data, given Code The City’s and Ian’s knowledge of, and enthusiasm, for this platform. 

How we made the data available

In the second part of this blog we will detail how we transcribed the data, prepared it for Wikidata, uploaded it in bulk, published mugshot photos and linked those. 

References

Astley, P. [Aberdeen Performing Arts]. (2021, February 23). Phil Astley – Criminal Portaits Webinar – Granite Noir 2021 [Video]. YouTube.
https://www.youtube.com/watch?v=UFcOG_7Cv0I&t=2346s 

Darby, N. (2014, 11 28). The ‘habit and repute’ thief in Scottish law. Retrieved from Dr Nelly Darby. Criminal Historian:
www.criminalhistorian.com/the-habit-and-reute-thief-in-scottish-law/

Finn, J. M. (2009). Capturing the criminal image: From mug shot to surveillance society. U of Minnesota Press.

McLean, R., Maitra, D. E. V., & Holligan, C. (2017). Voices of quiet desistance in UK prisons: Exploring emergence of new identities under desistance constraint. The Howard journal of crime and justice, 56(4), 437-453

Open Knowledge Foundation. (n.d.). Open Definition: Defining Open in Open Data, Open Content and Open Knowledge. Retrieved from Open Knowledge Foundation:
https://opendefinition.org/od/2.1/en/ 

Radzinowicz, L., & Hood, R. (1980). Incapacitating the habitual criminal: The English
experience. Michigan Law Review, 78(8), 1305-1389.

Ziegler, S. L. (2020). Open Data in Cultural Heritage Institutions: Can We Be Better Than Data Brokers?. Digital Humanities Quarterl, 14(2).

Social Sounds

A blog post by James Littlejohn.

CTC23 – the future of the City.  A new theme to explore. After introductions, initial ideas were sought for the Miro board – to ease us along Bruce put on some Jazz music. This was to inspire Dimi to put forward an idea on how sounds in a City could be. This post-its gathered interest and the Social Sounds project and team was formed.

Dimi shared his vision and existing knowledge on sound projects, namely, Luckas Martinelli project This would become the algorithmic starting point visualising sound data on a map. The first goal was to using this model and apply it and visualise a sound map of Aberdeen. This was achieved over the weekend but was only half of the visualisation goals.  The other half was to look build a set of tools that would allow communities to envision and demonstrate noise pollution reductions through interventions, green walls, trees plantings or even popup band stands.  An early proof of concept toolkit was produced. The social in social sounds references to community, connecting all those connected by sound and place. The product concluded by show how this social graph could be export to a decision making platform e.g.loomio.org 

What is next?  The algorithmic model needs to be ground with real world sound sensor data. Air quality devices in Aberdeen can be upgraded with a microphone. Also, noise itself needs to be included in the map experience, this can be achieved through a sound plug in of existing recordings. The toolkit needs much more work, it needs to give members of the community the ability to add their own intervention ideas and for those ideas to be visualised on the map, highlight the noise reduction potential or enhancement, permanent or temporary. Much achieved, much to do.

Using Wikidata to model Aberdeen’s Industrial Heritage

Saturday 6th March, 2021 was World Open Data Day. To mark this international event CTC ran a Wikidata Taster session. The objectives were to introduce attendees to Wikidata and how it works, and give them a few hours to familiarise themselves with how to add items, link items, and add images.

Presentation title screen

The theme of the session (to give it some structure and focus) was the Industrial Heritage of Aberdeen. More specifically the bygone industries of Aberdeen and, more specific still, the many Iron Foundries that once existed. I chose the specific topic as it is still relatively easy to spot the products of the industry on streets and pavements as we walk around the city, photograph those and add them to Wiki Commons, as I have been doing.

We had thirteen people book and eight turn up. After I gave a short presentation on how Wikidata operates we divided ourselves into three groups in breakout rooms. This was all on Zoom, of course, while we were still under lockdown.

The teams of attendees chose a foundry each: Barry, Henry & Cook Limited; Blaikie Brothers, and William McKinnon & Company Ltd. I’d already created an entry for John Duffus and Company in preparation for the event and to use as a model.

I’d also created a Google Sheet with a tab for each of the other thirteen foundries I’d identified (including those selected by the groups). I’d also spent quite a while trying to figure out how to access and search the old business and Post Office Directories for the city which had been digitised for 1824 to 1941. I eventually I built myself a tool, which I shared with the teams, which generated an URL for a specific search term for a certain directory. They used this, as well as other sources, to identify key dates, addresses and name changes of businesses.

By the end of the session our teams had created items for

They had also created items for foundry buildings – linked to Canmore etc, as well as founders. We enhanced these with places of their burial, portraits and images of gravestones. I took further photos which I uploaded to Commons and linked the following Monday. I created two Wikidata queries to show the businesses added, and the founders who created the businesses.

The statistics for the 3 hour session (although some worked into the afternoon and even the next day) are impressive. You can see more detail on the event dashboard.

We received positive feedback from the attendees who have been able to take their first steps towards using Wikidata as a public linked open data for heritage items.

I hope that the attendees will keep working on the iron founders until we have all of these represented on Wikidata. Next we can tackle shipbuilders and the granite industry!

Mapping Memorials to Women in Aberdeen

This project, which was part of CTC20,  grew from a WMUK / Archaeology Scotland join project carried out by Scottish Graduate School of Arts & Humanities intern Roberta Leotta during lockdown 2020. More details about the background to the project can be found here.

It’s often touted that there are some cities in Scotland (coughEdinburghcough) where there are more statues to animals than there are to women. In my own work transferring OpenPlaques data to Wikidata I’ve observed that there are more entries for Charles Rennie Macintosh than there for women in Glasgow. So in this light, it’s somewhat refreshing to work on a project that celebrates all kinds of memorials to women in Scotland.

The Women of Scotland: Mapping Memorials project began in 2010 as a joint project between Glasgow Women’s Library, and Women’s History Scotland. It’s similar in many ways to OpenPlaques, but using Wikidata could add an extra dimension – let’s increase the coverage of women’s history and culture on the Wikimedia projects by getting these memorials and the women they celebrate into Wikidata, use that to identify gaps in knowledge, and then work to fill the gap.

Over the two days, here’s what we did:

Data collection

We scraped the initial list of data from Mapping Memorials website manually, and created a shared worksheet based on a model that’s been used previously for other cities. (The manual process is slow, and a bit fiddly, and is the one thing that I wouldn’t do again. We’re in contact with the admin so going forward, I’m hopeful that we wouldn’t need to repeat this step in the future.)

Once we had this list, we could create a more automated process to deal with gathering the other pieces of information we needed to create new, good quality Wikidata items, although some (description, for example) needed a human eye.

Wikidata identifiers

We were using two main identifiers on Wikidata – P8048 (Women of Scotland memorial ID) and P8050 (Women of Scotland subject ID). The former for the entries to the memorials themselves, and the latter for the women they celebrate. Where the women didn’t have entries, we could create those, and then link them to the entries for the memorials.

Both identifiers use the last part of the URL for each entry on the Mapping Memorials site, so that was fairly easy to do in Google docs. Once we had that info, it’s an easy enough step to bulk-create items either using Quickstatements or Wikibase CLI.

Creating items & avoiding duplicates

There’s a plug in for Google Sheets called Wikipedia and Wikidata Tools which has some useful features for projects like this – WikidataQID for looking up whether something already exists on Wikidata, and WikidataFacts, which tells you what that item is. The former is ok if you have an exact match, the latter is really useful for flagging anything which might lead to a disambiguation page, for example.

Ultimately we did end up with a few duplicates that needed to be merged, but this was pretty easily managed, and it really showed how useful it is to have local knowledge involved in local projects – there were a couple of sets of coordinates that were obviously wrong, but also some errors that wouldn’t have been spotted by someone unfamiliar with the area.

Coordinates and dates

I really like Quickstatements, but there are a few areas in which it’s fiddly, including coordinates and dates. I’m really interested in looking further into Wikibase CLI for dates in particular, as the process there for dates (documented here) looks to be substantially easier in terms of data prep than it does in Quickstatements. Many thanks to Tony for that work, as his expertise saved us a lot of time! He also used that tool to create items for those women commemorated who were missing from Wikidata, documented here.

As with dates, coordinates are entered into Quickstatements in a different format than that which you’d use manually inside Wikidata itself, hence the formatting you’ll see in column Q on the Data collection tab. Most of this we had to grab from Google Maps, which again is a bit fiddly.

Quickstatements

Once we had a master list of QIDs for the memorials we were working with, we could use Quickstatements to bulk upload sets of statements to those items.

For example, matching the memorials to the women commemorated, using this format:

Screenshot of a spreadsheet showing QID for memorials and the women they commemorate

The Q numbers on the left are those of the memorials, P547 is “commemorates”, and the Q numbers on the right are those of the women celebrated. We were also able to add P8050 (Women of Scotland subject ID) to some women who already had entries on Wikidata, but no WoS ID.

Screenshot of a spreadsheet showing each memorial QID and its type

The Q number on the left again is the memorial, P31 is “instance of”, and the Q number on the right corresponds to a type of thing – a commemorative plaque, a garden, or a road, for example.

Once you’ve got the info in this format, it’s just a case of copy & pasting into QS, clicking import, and then run. (Note – you do need to be an autoconfirmed user to use QS, which means that your account must be at least 4 days old, and having more than 50 edits.) It’s relatively easy, and I was pleased that one of our relatively-new-to-Wikidata participants had the chance to make her first bulk uploads (description & commons category) using the tool over the weekend.

Photos

This project grew out of a desire to increase the coverage of Scottish heritage on Wikimedia Commons, so it was great to take some time on this. Mapping Memorials does have some images, but they’re not openly licensed, and others are missing. After Wikimedia Commons, our next port of call was Geograph, where many images have been released on Wiki-compatible Creative Commons licenses. Using Geograph2Commons, images can easily be transferred over to Wikimedia Commons, so that they can be used in any Wikimedia Project. Geograph also links to this feature from their site – click on “Find out how to reuse this image”, and then scroll down to “Wikipedia template for image page”, then click on the “geograph2commons” link. Really simple. Our group did some detective work for images, and then added them to Commons, and linked them manually to the Wikidata item.

This gave us a list of missing images… which is fine, but wouldn’t it be better to see them on a map?

Visualisation and filling the gaps

Thanks to Ian’s tutorial on how to create a custom WikiShootMe map, we were able to create a custom map that showed us which of the memorials we were working on had images, which didn’t, and where they were. That map is here, and it was great to see it slowly turn more green than red over the weekend as we found more images, or as volunteers headed out across Aberdeen between days to take missing pictures.

A screenshot of a clickable map where people can upload photos of monuments

One of the small, but very satisfying, things you can do with these kinds of images is to integrate them into relevant Wikipedia articles. I added images from the project to the articles for Aberdeen Town House, Caroline Phillips, and Katherine Grainger. At the time of writing, around 2500 people have viewed those articles since I added the images.

Next steps

Over the course of the weekend we added 77 new memorials, and 26 new women to Wikidata, as well as a whole host of new photos. These entries all had some quite rich data, and as complete as we could make it.

We were surprised to see some of the individuals who didn’t have a Wikipedia article – and of course, we can use the Wikidata query service to identify those gaps. The queries below could give us a great starting point for an editathon, or indeed, for any Wikipedia editor interested in writing Women’s biography.

  • Wikidata query for women with a Women of Scotland subject ID, a memorial in Aberdeen, but no enwiki article: https://w.wiki/YVH
  • Wikidata query for women with a Women of Scotland subject ID, but no enwiki article: https://w.wiki/YVG

Huge thanks to the team, and to Code the City for another great hack weekend!

Dr Sara Thomas
Scotland Programme Coordinator, Wikimedia UK

——————————————————————————

Header image: The Grave of Jessie Seymour Irvine by Ian Watt on Wiki Commons  (CC-BY-SA)

Mesolithic Deeside

Mesolithic Deeside is a group of archaeologists, students and local volunteers investigating the river Dee area 10,000 years ago. They’ve been gathering flints on seasonal field-walking trips and recording the data from the outputs of those allowing them to map Mesolithic Deeside.

Close up of hand holding a lithic

The following is a summary of what the the group with some additional helpers achieved over the two days of CTC20.

Day 1

Team: Andy, Ali, Sheila and Irvine

Notes:

  • Discussed the goals of the project with the Mesolithic Deeside Team
    • Displaying data visually for public consumption
    • Updating / refreshing the website
    • Looking at ways to identify future sites for test pitting
  • Decided to focus on developing a way of visualising the data that has been collected
  • Data is currently stored in a QGIS project and a number of csv files
  • Initial work looked into the possibility of using QGIS and Tableau for visualisation
  • Tableau was later dropped in favour of QGIS
  • Issues with Andy loading QGIS data from the project – no reason why it shouldn’t work
  • Decided that Irvine would focus on working with QGIS and Andy would focus on finding a solution with Google Maps
  • Andy has selected a subset of the data and is currently working to put that data on a Google Map
  • Data needs to be cleaned and tidied up before being displayed, i.e typos, consistent name formatting
  • Currently working with Google Sites & Awesome Table
    • Awesome table works with Google Sheets and picks up certain types from a header row – can be tricky to get working
    • Unable to disable clustering when zoomed in

Example of AwesomeTable as a Map with clustering


Example of data being filtered by flint type


Example of colour coding for the different finds


Day 2

Team 1: Andy, Robert & Irvine

Team 2: Ali, Sheila & Dave

Objectives:

  • Collate the finds data into a single spreadsheet
  • Investigate simple HTML / JS implementation of a google map with filter

Notes:

  • Two extra members joined our group today: Robert and Dave
  • Provided an update and explanation of what we have done so far to Robert and Dave
  • Andy had done some extra investigating into display finds data on a google map and found that AwesomeTable was limited to a 100 views total before having to pay and suggested that looking into a free option using javascript and HTML would be a better option
  • It was decided that the we split into two groups:
    • Ali, Sheila and Dave would explore options for the Mesolithic Deeside website
    • Andy, Irvine and Robert would continue working with the flint data
  • The following codepen was found showing what we were looking for, however, the code and script was not runnable, which meant devising our own code
  • Andy focused on gathering together individual spreadsheets into a single google sheet that would later be converted to a json file for loading into the google map
    • Contains over 8,000 flint samples
    • Files needed to be manually joined as columns differed between files
  • Irvine tidied up the dropbox to ensure that only processed spreadsheet files were ready for loading, and helped with any issues that came up with the files
  • A number of entries under type needed tidying up to catch variations in spelling and change in case
  • Before loading into Google Maps, the X & Y co-ordinates needed converting from OSGB36 to Lat & Long
  • Robert began working with Google Maps API to get info boxes and data points onto a google map

https://github.com/CodeTheCity/ctc20-mesolithic-deeside

Example of an info box and colour-coded points by find type.

Multiple points displayed at once on a zoomed out version of the map.

Summary of Technologies Used

Technology Description Comments
QGIS Original software used by Mesolithic Deeside for collating the flint finds Looked at options to use QGIS cloud, but features were limited.

Andy had issues loading the shape files and project files – likely to be a problem with Andy’s setup, as version was up to date

Python Conversion of co-ordinates from OSGB36 to Lat & Long

Conversion of main spreadsheet to JSON file

Robert put together a short script for carrying out the conversion of co-ordinates, however, points were offset. Method dropped in favour of Batch Convert Tool.
AwesomeTable Seems like a simple way to display and visualise data on a website. Has multiple options for tables and maps. Allowed for quick displaying and filtering of data. No need to worry about coding.

Limited to 100 views before you had to start paying.

Ditched in favour of a manual solution.

Batch Convert Tool Quickly converts osgb36 to wgs84 or wgs84 to osgb36 and vice versa. (link) Very quick when converting 6,000 points at once.
Google Maps (My Maps) Initially tested for displaying the points on a Google Map Limited functionality, but points could be easily colour coded for a simple visualisation
Google Maps API, Javascript & HTML A manual way of displaying a Google Map on a webpage. Allows for full control over what is displayed. Google Maps API was very tricky to work with. Took a bit of working out how to get points and info boxes to display correctly.

The selected solution for going forward

Google Sheets Used for compiling flint finds into one file from multiple csv files. Easily allowed multiple users to work on the same spreadsheet at the same time

Close up of hand holding a lithic

Header and other images of lithics by Mesolithic Deeside on Wikimedia Commons CC-BY-SA