
Mesolithic Deeside is a group of archaeologists, students and local volunteers investigating the river Dee area 10,000 years ago. They’ve been gathering flints on seasonal field-walking trips and recording the data from the outputs of those allowing them to map Mesolithic Deeside.
The following is a summary of what the the group with some additional helpers achieved over the two days of CTC20.
Day 1
Team: Andy, Ali, Sheila and Irvine
Notes:
- Discussed the goals of the project with the Mesolithic Deeside Team
- Displaying data visually for public consumption
- Updating / refreshing the website
- Looking at ways to identify future sites for test pitting
- Decided to focus on developing a way of visualising the data that has been collected
- Data is currently stored in a QGIS project and a number of csv files
- Initial work looked into the possibility of using QGIS and Tableau for visualisation
- Tableau was later dropped in favour of QGIS
- Issues with Andy loading QGIS data from the project – no reason why it shouldn’t work
- Decided that Irvine would focus on working with QGIS and Andy would focus on finding a solution with Google Maps
- Andy has selected a subset of the data and is currently working to put that data on a Google Map
- Data needs to be cleaned and tidied up before being displayed, i.e typos, consistent name formatting
- Currently working with Google Sites & Awesome Table
- Awesome table works with Google Sheets and picks up certain types from a header row – can be tricky to get working
- Unable to disable clustering when zoomed in


Day 2
Team 1: Andy, Robert & Irvine
Team 2: Ali, Sheila & Dave
Objectives:
- Collate the finds data into a single spreadsheet
- Investigate simple HTML / JS implementation of a google map with filter
Notes:
- Two extra members joined our group today: Robert and Dave
- Provided an update and explanation of what we have done so far to Robert and Dave
- Andy had done some extra investigating into display finds data on a google map and found that AwesomeTable was limited to a 100 views total before having to pay and suggested that looking into a free option using javascript and HTML would be a better option
- It was decided that the we split into two groups:
- Ali, Sheila and Dave would explore options for the Mesolithic Deeside website
- Andy, Irvine and Robert would continue working with the flint data
- The following codepen was found showing what we were looking for, however, the code and script was not runnable, which meant devising our own code
- Andy focused on gathering together individual spreadsheets into a single google sheet that would later be converted to a json file for loading into the google map
- Contains over 8,000 flint samples
- Files needed to be manually joined as columns differed between files
- Irvine tidied up the dropbox to ensure that only processed spreadsheet files were ready for loading, and helped with any issues that came up with the files
- A number of entries under type needed tidying up to catch variations in spelling and change in case
- Before loading into Google Maps, the X & Y co-ordinates needed converting from OSGB36 to Lat & Long
- Robert investigated a Python library for the conversion, but when the results were plotted they were offset so another option was needed
- Ian suggested the following for batch conversion https://gridreferencefinder.com/batchConvert/batchConvert.php
- Robert began working with Google Maps API to get info boxes and data points onto a google map
https://github.com/CodeTheCity/ctc20-mesolithic-deeside


Summary of Technologies Used
| Technology | Description | Comments |
|---|---|---|
| QGIS | Original software used by Mesolithic Deeside for collating the flint finds | Looked at options to use QGIS cloud, but features were limited.
Andy had issues loading the shape files and project files – likely to be a problem with Andy’s setup, as version was up to date |
| Python | Conversion of co-ordinates from OSGB36 to Lat & Long
Conversion of main spreadsheet to JSON file |
Robert put together a short script for carrying out the conversion of co-ordinates, however, points were offset. Method dropped in favour of Batch Convert Tool. |
| AwesomeTable | Seems like a simple way to display and visualise data on a website. Has multiple options for tables and maps. | Allowed for quick displaying and filtering of data. No need to worry about coding.
Limited to 100 views before you had to start paying. Ditched in favour of a manual solution. |
| Batch Convert Tool | Quickly converts osgb36 to wgs84 or wgs84 to osgb36 and vice versa. (link) | Very quick when converting 6,000 points at once. |
| Google Maps (My Maps) | Initially tested for displaying the points on a Google Map | Limited functionality, but points could be easily colour coded for a simple visualisation |
| Google Maps API, Javascript & HTML | A manual way of displaying a Google Map on a webpage. Allows for full control over what is displayed. | Google Maps API was very tricky to work with. Took a bit of working out how to get points and info boxes to display correctly.
The selected solution for going forward |
| Google Sheets | Used for compiling flint finds into one file from multiple csv files. | Easily allowed multiple users to work on the same spreadsheet at the same time |

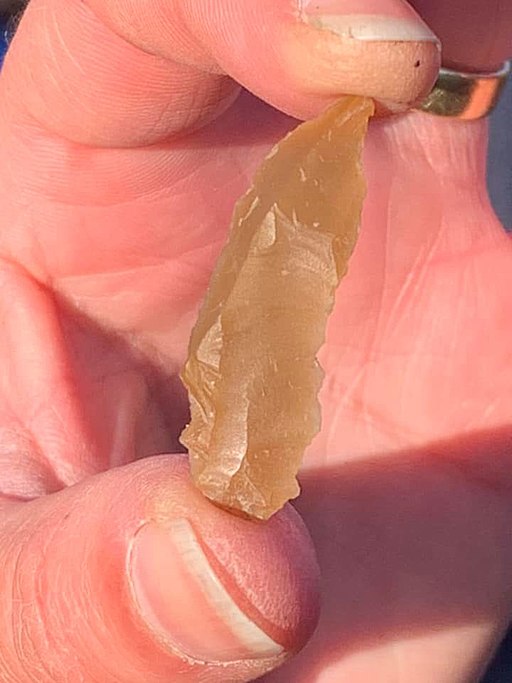
Header and other images of lithics by Mesolithic Deeside on Wikimedia Commons CC-BY-SA
