Aberdeen Provosts

In the run up to Code The City 19 we had several suggestions of potential projects that we could work on over the weekend. One was that we add all of the Provosts of Aberdeen to Wikidata. This appealed to me so I volunteered to work on it in a team with Wikimedia UK’s Scotland Programme Coordinator, Dr Sara Thomas, with whom I have worked on other projects.

In preparation for CTC19 I’d been reading up on the history of the City’s provosts and discovered that up to 1863 the official title was Provost, and from that point it was Lord Provost. I’d made changes to the Wikipedia page to reflect that, and I’d added an extra item to Wikidata so that we could create statements that properly reflected which position the people held.

Sara and I began by agreeing an approach and sharing resources. We made full use of Google Docs and Google Sheets.

We had two main sources of information on Provosts:

Running the project

I started by setting up a Google Sheet to pull data from Wikipedia as a first attempt to import a list to work with. The importHTML function in Google Sheets is a useful way to retrieve data in list or table format.

I entered the formula in the top left cell (A1):

=importhtml("https://en.wikipedia.org/wiki/List_of_provosts_of_Aberdeen", "list", 27)

and repeating the formula for all the lists – one per century. This populated our sheet with the numerous lists of provosts.

That state didn’t last very long. The query is dynamic. The structure of the Wikipedia page was being adapted, it appeared, with extra lists – so groups of former provosts kept disappearing from our sheet.

I decided to create a list manually – copying the HTML of the Wikipedia page and running some regex find and replace commands in a text editor to leave only the text we needed, which I then pasted into sheets.

Partial list of Provosts
Partial list of Lord Provosts

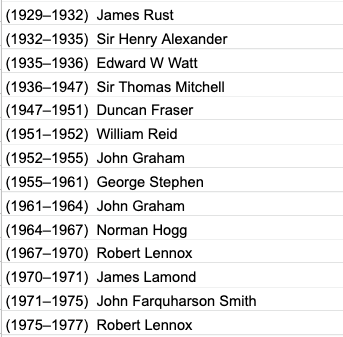
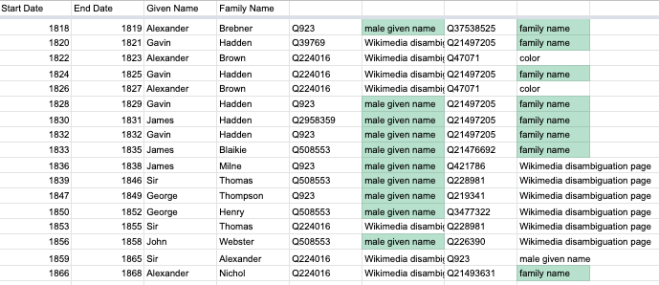
Once we had that in the Google Sheet we got to work with some formulae to clean and arrange the data. Our entries were in the form “(1410–1411) Robert Davidson” so we had to

    • split names from dates,
    • split the start dates from end dates, and
    • split names into family names and given names.

Having got that working (albeit with a few odd results to manually fix) Sara identified a Chrome plugin called “Wikipedia and WikiData tools” which proved really useful. For example we could query the term in a cell e.g. “Hadden” and get back the QID of the first instance of that. And we could point another query at the QID and ask what it was an instance of. If it was Family Name, or Given Name we could use those codes and only manually look up the others. That saved quite a bit of time.

Identifying QIDs for Given and Family Names

Our aim in all of this was to prepare a bulk upload to Wikidata with as little manual entry as possible. To do that Sara had identified Quickstatements, which is a bulk upload tool for Wikidata, which allows you to make large numbers of edits through a relatively simple interface.

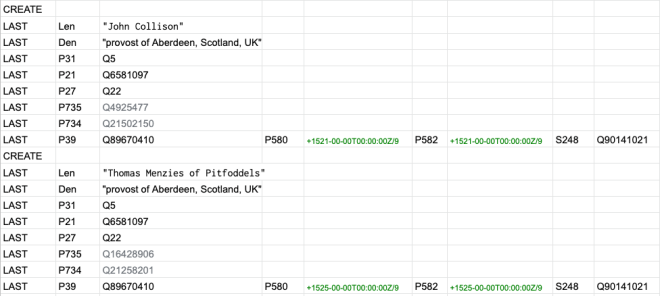
Sara created a model for what each item in Quickstatements should contain:

A model of a Quickstatements entry

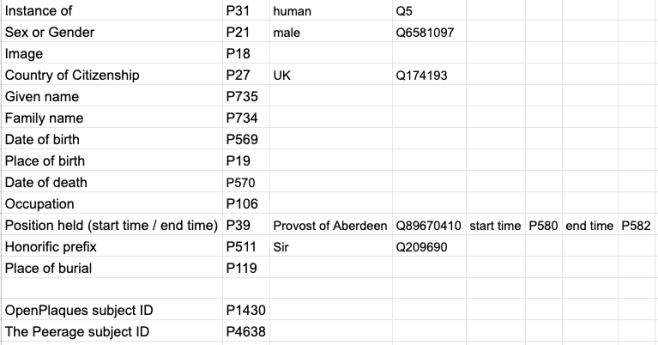
There are a few quirks – for example, how you format a date – but once you’ve got the basics down it’s an incredibly powerful tool. The help page is really very useful.

Where dates were concerned, I created a formula to look up the date in another cell then surround it with the formatting needed:

="+"&Sheet1!J99&"-00-00T00:00:00Z/9"

Which gave +1515-00-00T00:00:00Z/9 as the output.

You can also bulk-create items, which is what we did here. We found that it worked best in Firefox, after a few stumbles.

Data harvesting

As mentioned above, we used a printed source, from which we harvested the data about the individual Provosts.  It’s easy to get very detailed very quickly, but we decided on a basic upload for:

  • Name
  • First name
  • Last name
  • Position held (qualified by the dates)
  • Date of birth, and death (where available).

Some of our provosts held the position three or four times, often with breaks between. We attempted to work out a way to add the same role held twice with different date qualifiers, but ultimately this had to be done manually

The first upload

We made a few test batches – five or six entries to see how the process worked.

A test batch to upload via Quickstatements

When that worked we created larger batches. We concluded the weekend with all of the Provosts and Lord Provosts being added to Wikidata which was very satisfying. We also had a list of further tasks to carry out to enhance the data. These included:

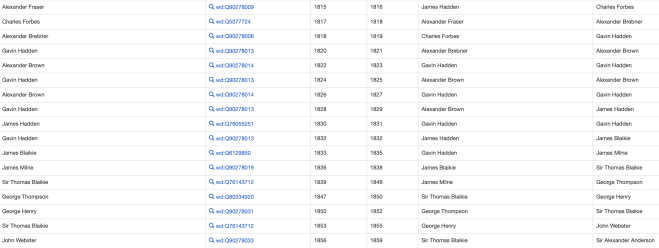
  • Add multiple terms of office – now complete,
  • Add statements for Replaces (P1365) and Replaced By (P1366) – partly done,
  • Add honorific titles, partly done
  • Add images of signatures (partly done) and portraits ( completed) from the reference book,
  • Add biographical details from the book – hardly started,
  • Source images for WIkiCommons from the collection portraits at AAGM – request sent,
  • Add places of burial, identifiers from Find A Grave, photographs of gravestones,
  • Add streets named after provosts and link them.

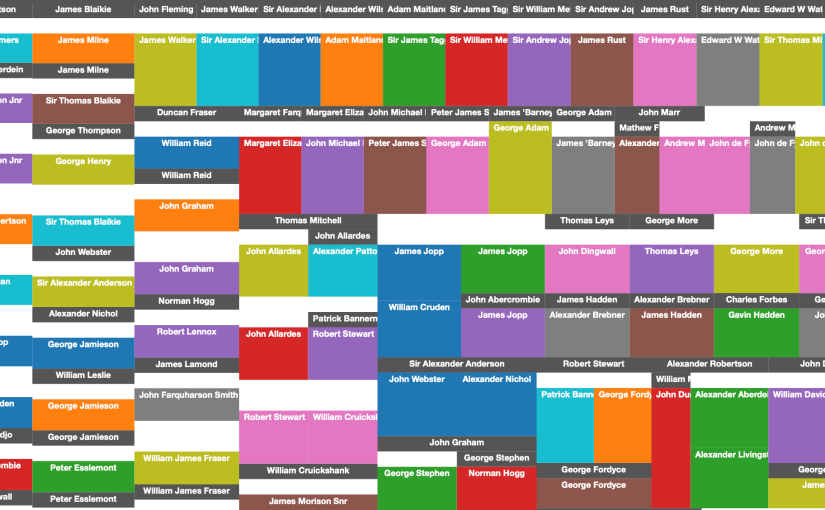
You can see the results in this WikiData query: https://w.wiki/PsF

A Wikidata Query showing Provosts' Terms of Office, and their replacements
A Wikidata Query showing Provosts’ Terms of Office, and their replacements

This was a very interesting project to work on – and there is still more to do to improve the data, which you can help with.

Aberdeen Harbour Board Arrivals Transcription Project

A blog post by Mollie Horne, Project Archivist at Aberdeen City and Aberdeenshire Archives and Ian Watt of Code The City.

The arrivals transcription project is an ongoing partnership between Code the City and Aberdeen City & Aberdeenshire Archives. It forms part of a wider project funded by the Archives Revealed initiative funded by The National Archives which aims to improve the accessibility of records.

The arrival registers are a small part of a much larger collection which was transferred to Aberdeen City and Aberdeenshire Archives as a result of a partnership with the Aberdeen Harbour Board.

The project was originally intended to be part of the physical Code the City 19 event in April 2020 but in anticipation of the nationwide restrictions, it was decided to move entirely online. In the week before we were told to work from home, Mollie photographed each individual page (all 649 of them) from the arrival registers from 1914-1920 and uploaded them to the Google Sheets system which had been set up by Ian. This meant that we had a large amount of material which could be worked on for an extended period.

After creating a set of guidelines and helpful links, we invited the public to work on transcribing and checking entries from March 27th onwards. As the online CTC19 event was scheduled for 11-12th April this allowed us two weeks to create enough data to be useful to the coders over the official weekend.

Transcribers accessed two Google sheets. The first was to log their participation and note what photograph they were transcribing.

The second sheet was the one into which they transcribed the data.

Example of 1916 transcription

We also set up an open Slack group where transcribers could chat, ask questions, get help etc.

Progress was rapid: by the end of the weekend almost 4,000 records had been transcribed and checked. At the time of writing (2nd May 2020) that has now grown to over 7,000 records transcribed.

When an image has been transcribed, and checked, we lock off the entries to preserve them form change.

The data which had been transcribed was used to create a website, set up by Andrew Sage of CTC, where we could see information in a collated an organised way – this was extremely useful to inform other transcriptions. So far we have managed to fully complete 1914 and are working through the rest of the years.

The arrivals transcription project started as a great way to highlight an important time in the history of the Harbour, which has always been a big part of Aberdeen. However, given current circumstances, it has also become a great opportunity to give people something to focus on.

The project remains open – and you can still get involved by contributing just an hour or two of your time. Start here.

You can lead a horse to water but Covid19 data must be scraped

Just over a month ago I wrote about the lack of Covid19 Open Data for Scotland.

I showed how the Italian health authorities were doing just what was needed in the most difficult of circumstances. I explained how, in the absence of an official publication of open data (in an openly-licensed, neutral format, machine-readable format ) I’d taken it on myself on 15th March 2020 to gather and publish the data. My hope was that I’d have to do it for a week or two then the Scottish Government would take over.

And here we are five weeks and one day later and I am still having to do it. Meantime a growing list of websites and applications has developed to use the data which is great but adds to the pressure.

So what’s happened in the intervening time and, more importantly, what hasn’t?

From manual to coded scraping

Originally I was gathering the data manually. Going to the Scottish Government web page and retyping the data into CSVs. This is a terrible practice – open to errors and demanding double and triple checking before pushing to Github. While it looked like my publication was going to be short term that hardly mattered.

But as the weeks dragged by I had to concede that there was no rescue coming from Scottish Government any time soon. Initially it appeared that the daily data was going to be published openly via their statistics platform. That eventually morphed into an additional but different set of data (from National Records of Scotland, not HPS).

So, I resolved to build a scraper – a piece of code that will read the HTML of a webpage and extract the data from that. Sounds easy – but in practice it can be far from it.  And when all is said and done it is the most brittle of solutions: as any small change can break the code.

SG Nested Span Tags
Nested Span Tags on the SG web page

Given how poorly the page was structured (endless nested blank span tags being just one crime against HTML) I didn’t have a great deal of confidence that it could be kept working.

I built it and tested it daily but it wasn’t until 14th April that I was confident enough that it would work daily. Even then it wouldn’t take much to derail it. At that point it was 360 lines of code just to get a few dozens numeric values from a single page.

There is probably some law named after someone wiser than me that says that once you launch a piece of software it will be broken the very next day, and so it did the very next morning. The scraper relies on knowing the structure of a page – finding bulleted lists, tables, and iterating through those structures looking for patterns to match and grabbing the numbers.

Since then the Scottish Government have changed the structure of the page as many as six times, including

  • making the final item in a bulleted list into a new paragraph on its own right,
  • removing a table completely,
  • and today changing the format of numbers in a table to include commas where none were used before.
Text all in bullets
Text all in bullets
Final list item now a para

If you are interested I have archived the page contents for each day (minus the styling).

A breakthrough?

Last week it looked like we might have an easier solution on our hands: not only did they change the URL of the page with the data, they then without fanfare added a new XLSX spreadsheet with the daily data in it, updated each day. While not a CSV file, it appeared that it would be very useful.

So yesterday I started to code up a routine to

  • grab the XSLX file,
  • download that,
  • save it as a reference copy, then
  • figure out the worksheet names which have data, not charts,
  • go to those worksheets,
  • find the ranges with the data (ignoring comments in rows above the data, to the right of the data, below the data – see image below),
  • extract that data and write it back to plain CSV files as I was doing wth my original scraper.
A screenshot of one worksheet showing one area of data and three of non-data (red)
A screenshot of one worksheet showing one area of data (green) and three of non-data (red)

Having tested the first part of it yesterday I re-ran it today and it broke. It turns out the URL at which the spreadsheet is published changes from day to day. I suspect that this is as a result of some sort of Content Management System.

All of which means I have to now do another scraper to identify each day’s URL before I can do any of the above.

Why are we in this position?

The current position defies logic. There are so many factors that should have meant that Scottish Government would have this sorted out by now.

  1. I’d identified the need for plain CSV publishing previously, and very publicly, giving good examples.
  2. I’d had an email from contact in SG mentioning two of my CSV files (in the context of the forthcoming NRS data publication).
  3. I work as part of the Civic Society group as part of the Open Government partnership, and I am the lead for open data.
  4. So people know where to find me and interact with me.
  5. I have blogged extensively about what we need – and have emailed contacts at SG.
  6. As part of the planning for Scottish Open Data Unconference I set up a Slack group to which SG contacts were invited – and I believe some signed up.
  7. So there are forms through which, if there was any uncertainty, anyone at SG could ask “what does the data community want?” or “we’re thinking about doing ‘x’ would that work for you?” But there has been no such approach.

Meantime, I’ve spent many 10s of hours for no financial reward doing what Peter Drucker called ‘doing the wrong thing righter.” i.e. allowing the SG to continue to publish data wrongly on the basis that the effort is transferred onto the community to create work-arounds.

After five weeks of doing this daily, I’m absolutely fed up of it. I’m going to formally raise it through the Open Government Partnership with a view to getting the right data, in the right format, published daily.


Header picture cropped from a photo by Nathan Dumlao on Unsplash

Scotland’s Covid-19 Open Data

We are in unprecedented times. People are trying to make sense of what is going on around them and the demands for up to date, even up-to-the-minute,  information is as never before. Journalists, data scientists, immunologists, epidemiologists and others are looking for data to use to develop that information for the broader public, as well as to feed into predictive modelling. That means that governments and Health Services at all levels (UK and Scotland) need to be publishing that data quickly, consistently, and in a way that makes it easy for the data users to consume it. They need to look at best practice and quickly adopt those standards and approaches.

Let’s start with what this post is not. It is not a criticism of some very hard pressed people in NHS Scotland and Scottish Government who are trying very hard to do the right thing.

So, what is it? It is an honest suggestion of how the Scottish Government must adapt in how it publishes data on the most pressing issue of modern times.

The last five days

Last Sunday, 15th March, as the number of people in Scotland with Covid-19 started to climb in Scotland (even if numbers were still low in comparison to other EU countries) I went looking for open data on which I could start to plan some analysis and visualisation. And I found none.

What I did find was a static HTML webpage. This had the figures for that day:  the  total number of tests conducted, the total number of negative results, and the number of positive cases for each Health Board. This page is then overwritten at 2pm the next day. This is an awful practice, also used by Scotrail to hide its performance month on month.

I was able, using the Internet Wayback machine, to fill in some gaps back to 5th March but that was far from complete. I published what I could on GitHub and mentioned that on Twitter and in a couple of Slack Groups. Thankfully a friend, Lesley, was ahead of me in terms of data collection for her work as a data journalist, and was able to furnish testing data back to the start on 24 January 2020. Since then I’ve updated the GitHub repo daily – usually when the data is published at 2pm.

Almost immediately I began, a couple of people started to build visualisations based on what I had put in GitHub including this one. Some said that they were waiting for the numbers to climb to more significant levels, particularly deaths before they would start to use the data.

Two or three times the data has been published then corrected with some test results for Shetland / Grampian being reassigned between the two. This is understandable given the current circumstances.

SG webpage with table of Covid19 daily cases

On 19 March 2020, the 2pm publication was delayed, with the number of fatalities, and positive results being published after 3.30pm and the total number of tests being published after 7pm. Again – this is undertandable. The present circumstances are unprecedented, process are being developed. Up to now much of Scotland’s open data publication has been done, if at all, at a more leisurely and considered pace. It does make one wonder how, as the numbers rise exponentially, as they surely will, how the processes will cope.

Why is this important?

At this time the public are trying to make sense of a very difficult situation. Journalists, scientists and others are trying to assist in that by interpreting what data there is for them, including building visualisations of that. People are also seeking reassurances – that the UK and Scottish Government are on top of the situation. Transparency around government activity such as testing, and the spread of the virus, would build trust. Indeed there is real concern that Scotland, and the UK as a whole, is not meeting WHO guidance on testing and tracing cases.

But with a static web page, with limited range of data that is erased daily, this is not possible. Even setting up a scraper to grab the essential content from that page is not feasible if the data is only partially published for long periods.

We have some useful data visualisations such as this set by Lesley herself. What can be done is limited. Deaths per health board are are collected, we’ve been told, but they are not published – only a Scotland-level total.

I’ve had it confirmed by someone I know in the Scottish Government that they are looking at creating and posting Linked Open Data which I suspect will be on their platform, which is a great resource but which is seen by many as a barrier to actually getting data quickly and simply.

Italian government GitHub repo

Compare this with the Italian Government who have won plaudits from the data science, journalism and developer communities for making their data available quickly and simply using GitHub  as the platform. This is one that is familiar to the end-users. They also have a great range of background information (look at it in Chrome which will translate it). On that platform they publish daily national and regional statistics for

  • date
  • state
  • hospitalised with symptoms
  • intensive care
  • total hospitalised
  • home isolation
  • total currently positive
  • new currently positive
  • discharged healed
  • deceased
  • total cases
  • swabs tests.

Not only is the data feeding the larger, world-wide analysis such as that by Johns Hopkins University, but people at a national level are using that data to create some compelling, interactive visualisations such as this one. As each country starts to recover and infections and deaths start to slow, having ways o visualising that depends on data to drive those views.

[edited] Wouldn’t a dashboard such as this one for Singapore, built by volunteers, be a good thing for Scotland? We could do it with the right data supplied.

Singapore dashboard
Singapore dashboard

[/edited]

So, this is a suggestion, or rather a request, to NHS Scotland and the Scottish Government to put in place a better set of published data, which is made available in as simple and as timely a fashion as can be accomplished under the present circumstances. Give us the data and we’ll crowd-source some useful tools built on it.

How to do that?

The Scottish Government should look to fork one of the current repositories and using that as a starting point. In an ideal world that would be the Italian one – but even starting with my simple one (if the former is too much) would be a step forward.

Also, I would encourage the government to get involved in the conversations that are already happening – here for example in the Scottish Open Data group.

There is a large and growing community there, composed of open data practitioners, enthusiasts and consumers, across many disciplines, who can help and are willing to support the government’s work in this area.

SODU2020 – a guest post by Sarah Roberts of Swirrl

Scottish Open Data Unconference

It’s all going on in Scotland in March. As we spring into Spring (nearly there!), we’re very excited to be sponsoring, and going, to the Scottish Open Data Unconference in Aberdeen on 14th and 15th March. Topics are pitched in the morning of each day, an agenda is created and participants talk as much as the chair. 

Our colleague Jamie Whyte is lucky enough to have a ticket, so if you spot him do say hi! Here are some recent open data happenings we’ve picked up on our radar…

Scottish Index of Multiple Deprivation

The Scottish Index of Multiple Deprivation was released late January and we loved the accompanying briefing document, which put the numbers into context (find it here). The data’s also available on the Scottish Government’s Open Data site, where you can use the Atlas section to find key data zones and see key facts about them. The below screenshot is of the data zone which is ranked as the most deprived in the 2020 SIMD.

SIMD - Greenock Town centre
SIMD – Greenock Town centre

People are already making stuff with the data — below is a screenshot of Jamie’s lava lamp visualisation of the data

Commentary, explanation and analysis from others include: Alasdair Rae’s summary matrix of the SIMD data by council area, a story graphic of the data, an interactive mapping tool, an analysis blog post from Scottish parliament information centre and news articles, like this one from the BBC.

Jamie Whyte - King of the Lava Lamp
Jamie Whyte – King of the Lava Lamp image

W3C Community Group

Another thing we’ve noticed is that there’s preliminary work happening on GraphQL and RDF, which aims to serve as a case for future standardisation. More on this here, where you can send a request to join the group if this is your bag. It’s definitely ours! 

Collaborative work with data

Last, but not least, collaboration. This is a wide concept but it’s also a trend that’s cropping up in different aspects of working with open data. Here are some we’ve noticed:

“promote trust and co-operation between government and civil society.”

  • The Office for National Statistics is publishing data in a collaborative project across a spread of organisations including ONS, HMRC, MHCLG, DWP and DIT. The Connected Open Government Statistics (COGS) project involves a lot of technical collaborative work in harmonising codelists, as well as harmonising a data model and all the processes that go into it. More on this project here on the GSS blog site. 
  • 2019 saw a growing, collaborative API community, with API events involving government and people working with government. We went to one in Newcastle and another one’s arranged for March 16th (if you’re still hungry for more after the unconference!) 
  • The Open Data Institute have been busy, busy, busy. Jeni Tennison spoke about the idea of how collaboration is key for new institutions of the data age, at our Power of Data conference in October (catch that video here). The ODI have also been working on a data and public services toolkit & there’s an introductory event to this in Edinburgh just a few days before the Scottish Open Data Unconference. 

Thanks for reading! If you’d like to find out a bit more about who we are and what we do, take a look at our website, our blog, our latest newsletter and / or our twitter stream. We’ve just been named as one of the FT1000 fastest growing companies in Europe and we’re still hiring, so if you think you can help us we’d love to hear from you. 

We love data and we’re delighted to be sponsoring the Scottish Open Data Unconference. See you there.